Full Report
The numbers behind EQT Corporation: as-reported financial statements and company metrics for FY2021–FY2025, traced to the source filings, opened with the share-price history those statements have to justify. Every linked figure opens the exact page of the filing it was printed on, with the statement row highlighted. Amounts in US$ millions unless noted.
Reading notes: All figures are presented in US$ millions; EQT's filings print the statements in thousands, so linked figures highlight the thousands-denominated row on the source page (e.g. the tab's 7,727 links to the printed 7,726,712). Citation filings: FY2025 and FY2024 columns are cited to the FY2025 Form 10-K (FY2024 as its comparative column); FY2023 and FY2022 to the FY2023 Form 10-K; FY2021 income statement, cash flow and product/volume detail to the FY2023 Form 10-K (restated comparative) and the FY2021 balance sheet to the FY2022 Form 10-K (restated). Revenue is disaggregated into the product cut (natural gas, NGLs, oil) that ties to the 'Sales of natural gas, NGLs and oil' line, plus the two other operating-revenue lines the company reports on the face of the income statement (gain/loss on derivatives; pipeline and other). Derivative gains/losses make Total operating revenues volatile year to year. FY2016–FY2020 long-term figures are from the standardized SEC XBRL data feed (data/financials/.json) and are shown without page links; FY2016 and FY2017 product-sales revenue is not carried in the feed and is left blank.*
Share Price — Full Available History — 37 Years
The stock closed at $53.29 on Jul 31, 2026 — up 15,689% over the window shown (+14.8% a year), trading between $0.28 and $67.93. At that close the stock trades at 16× FY2025 diluted EPS as reported below.
Source: market price feed, monthly closes, sampled from 9,213 source observations, Jan 1990–Jul 2026. Price return only, excludes dividends. Prices are split-adjusted (×1.5 on Jan 26, 1993; 1:2 on Jun 12, 2001; 1:2 on Sep 02, 2005; ×1.837 on Nov 13, 2018).
Market capitalization $32.8bn and enterprise value $40.5bn.
Market cap = 615.7M shares outstanding × the Jul 31, 2026 close of $53.29. Enterprise value adds total debt of $7.8bn and subtracts cash and equivalents of $111mn (net debt of $7.7bn), from the FY2025 balance sheet. Market-derived figures, shown without filing links.
FY2025 at a Glance
Revenue (US$ millions)
Operating income (US$ millions)
Net income (US$ millions)
Diluted EPS
Source: FY2025 consolidated statements [1] [2]. Click any linked figure to open the filing page with the row highlighted.
Revenue by Product and Source
| Revenue by Product and Source | FY2021 | FY2022 | FY2023 | FY2024 | FY2025 |
|---|---|---|---|---|---|
| Natural gas sales | 6,180 | 11,448 | 4,521 | 4,225 | 7,019 |
| NGLs sales | 532 | 587 | 428 | 616 | 620 |
| Oil sales | 92 | 79 | 96 | 94 | 88 |
| Sales of natural gas, NGLs and oil | 6,804 | 12,114 | 5,045 | 4,934 | 7,727 |
| Gain (loss) on derivatives | (3,775) | (4,643) | 1,839 | 51 | 291 |
| Pipeline and other | 36 | 26 | 25 | 288 | 627 |
| Total operating revenues | 3,065 | 7,498 | 6,909 | 5,273 | 8,644 |
| Total operating revenues growth, derived | — | +144.6% | -7.9% | -23.7% | +63.9% |
Source: Statements of Consolidated Operations; Note 3 Revenue from Contracts with Customers (product split) [3] [1] [4] [2]. Click any linked figure to open the filing page with the row highlighted.
Income Statement
Source: Statements of Consolidated Operations [1] [2]. Click any linked figure to open the filing page with the row highlighted.
Columns marked E are consensus analyst estimates from S&P Capital IQ (CapIQ), shown alongside reported results for direct comparison; they are not company guidance.
Estimate source: S&P Capital IQ (CapIQ) consensus, as of 2026-08-02. Estimate figures are S&P Capital IQ consensus (vendor data — no filing page links). EPS and net income use the normalized (adjusted) consensus where the street reports it. Line-item analyst models (segments, drivers, KPIs) are in the Visible Alpha tab.
Balance Sheet
Source: Consolidated Balance Sheets [5] [6] [7]. Click any linked figure to open the filing page with the row highlighted.
Cash Flow
Source: Statements of Consolidated Cash Flows [8] [9]. Click any linked figure to open the filing page with the row highlighted.
Production Realized Pricing
| Production Realized Pricing | FY2021 | FY2022 | FY2023 | FY2024 | FY2025 |
|---|---|---|---|---|---|
| Total sales volume (MMcfe) | 1,857,817 | 1,940,043 | 2,016,273 | 2,228,159 | 2,382,367 |
| Average daily sales volume (MMcfe/d) | 5,090 | 5,315 | 5,524 | 6,088 | 6,527 |
| Average realized price ($/Mcfe) | 2.50 | 3.17 | 2.79 | 2.74 | 3.19 |
| Average wellhead natural gas price ($/Mcf) | 4.17 | 6.99 | 2.88 | 2.43 | 3.61 |
| NYMEX benchmark price ($/MMBtu) | 3.97 | 6.64 | 2.74 | 2.30 | 3.42 |
Source: company filings [10] [11] [12] [13]. Click any linked figure to open the filing page with the row highlighted.
Unit Operating Costs ($/Mcfe)
| Unit Operating Costs ($/Mcfe) | FY2021 | FY2022 | FY2023 | FY2024 | FY2025 |
|---|---|---|---|---|---|
| Lease operating expense (LOE) | 0.07 | 0.08 | 0.08 | 0.09 | 0.09 |
| Production taxes | 0.05 | 0.07 | 0.05 | 0.08 | 0.07 |
| Production depletion (DD A) | 0.89 | 0.85 | 0.84 | 0.90 | 0.95 |
| Selling, general and administrative | 0.11 | 0.13 | 0.12 | 0.11 | 0.09 |
Source: company filings [10] [14] [15]. Click any linked figure to open the filing page with the row highlighted.
Proved Reserves (year-end, Bcfe)
| Proved Reserves (year-end, Bcfe) | FY2021 | FY2022 | FY2023 | FY2024 | FY2025 |
|---|---|---|---|---|---|
| Total proved reserves | 24,962 | 25,003 | 27,597 | 26,265 | 28,046 |
| Proved developed reserves | 17,219 | 17,514 | 19,558 | 18,805 | 20,581 |
| Proved undeveloped reserves (PUD) | 7,743 | 7,489 | 8,039 | 7,460 | 7,465 |
Source: company filings [16] [17] [18] [19]. Click any linked figure to open the filing page with the row highlighted.
Reserve Value at SEC Pricing (year-end)
| Reserve Value at SEC Pricing (year-end) | FY2021 | FY2022 | FY2023 | FY2024 | FY2025 |
|---|---|---|---|---|---|
| Standardized Measure of discounted future net cash flows | 17,281 | 40,065 | 9,262 | 7,999 | 21,310 |
| PV-10 of proved reserves | 21,496 | 51,512 | 11,520 | 9,844 | 25,594 |
| SEC reserve price — natural gas ($/Mcf) | 2.69 | 5.54 | 1.70 | 1.47 | 2.75 |
Source: company filings [20] [21]. Click any linked figure to open the filing page with the row highlighted.
Long-Term Record
| Fiscal year | Sales of natural gas, NGLs and oil | Net income (loss) attributable to EQT Corporation | Basic earnings (loss) per share | Net cash provided by operating activities | Capital expenditures |
|---|---|---|---|---|---|
| FY2016 | — | (453) | (2.71) | 1,064 | 943 |
| FY2017 | — | 1,509 | 8.05 | 1,638 | 1,559 |
| FY2018 | 4,709 | (2,245) | (8.60) | 2,976 | 2,999 |
| FY2019 | 3,791 | (1,222) | (4.79) | 1,852 | 1,602 |
| FY2020 | 2,650 | (959) | (3.68) | 1,538 | 1,042 |
| FY2021 | 6,804 | (1,143) | (3.54) | 1,662 | 1,055 |
| FY2022 | 12,114 | 1,771 | 4.79 | 3,466 | 1,400 |
| FY2023 | 5,045 | 1,735 | 4.56 | 3,179 | 2,019 |
| FY2024 | 4,934 | 231 | 0.45 | 2,827 | 2,254 |
| FY2025 | 7,727 | 2,039 | 3.33 | 5,126 | 2,288 |
Source: consolidated statements across filings; older years from the standardized feed [8] [1] [9] [2]. Click any linked figure to open the filing page with the row highlighted.
Operating KPIs
| KPI | FY2021 | FY2022 | FY2023 | FY2024 | FY2025 |
|---|---|---|---|---|---|
| Total sales volume (MMcfe) | 1,857,817 | 1,940,043 | 2,016,273 | 2,228,159 | 2,382,367 |
Source: company-reported operating metrics [22] [23]. Click any linked figure to open the filing page with the row highlighted.
Analyst Consensus
Mean target
Median target
High target
Low target
Street ratings: 17 strong buy, 3 buy, 5 hold. Consensus: Buy.
Estimate source: S&P Capital IQ (CapIQ) consensus, as of 2026-08-02. Estimate figures are S&P Capital IQ consensus (vendor data — no filing page links). EPS and net income use the normalized (adjusted) consensus where the street reports it. Line-item analyst models (segments, drivers, KPIs) are in the Visible Alpha tab.
Traceability
374 of 440 figures on this page (85%) link to the filing page where they are printed — click a linked figure to open the source PDF at that page with the row highlighted. Unlinked figures come from standardized data feeds or pre-filing years.
All figures are presented in US$ millions; EQT's filings print the statements in thousands, so linked figures highlight the thousands-denominated row on the source page (e.g. the tab's 7,727 links to the printed 7,726,712).
Citation filings: FY2025 and FY2024 columns are cited to the FY2025 Form 10-K (FY2024 as its comparative column); FY2023 and FY2022 to the FY2023 Form 10-K; FY2021 income statement, cash flow and product/volume detail to the FY2023 Form 10-K (restated comparative) and the FY2021 balance sheet to the FY2022 Form 10-K (restated).
Revenue is disaggregated into the product cut (natural gas, NGLs, oil) that ties to the 'Sales of natural gas, NGLs and oil' line, plus the two other operating-revenue lines the company reports on the face of the income statement (gain/loss on derivatives; pipeline and other). Derivative gains/losses make Total operating revenues volatile year to year.
FY2016–FY2020 long-term figures are from the standardized SEC XBRL data feed (data/financials/*.json) and are shown without page links; FY2016 and FY2017 product-sales revenue is not carried in the feed and is left blank.
The July 2024 Equitrans Midstream acquisition made EQT vertically integrated; from FY2024 the income statement adds midstream lines (Operating and maintenance; Pipeline revenue) and the balance sheet adds Goodwill and larger Investments in unconsolidated entities. Some expense-line labels were reclassified across years (e.g. Depreciation and depletion - Depreciation, depletion and amortization; a portion of Production reclassified to Operating and maintenance), so each cell is cited to a page where that value is printed with the label shown.
Quarterly cash flow is omitted: EQT's 10-Qs print cash flows only on a year-to-date basis and a full quarterly cash-flow series with Q4 derivation added limited signal for this tab; annual cash flow is fully cited above.
3 figure(s) differed between the data feed and the filing; the filing value is shown (see the run's metrics/metrics_tab.json for the audit trail).
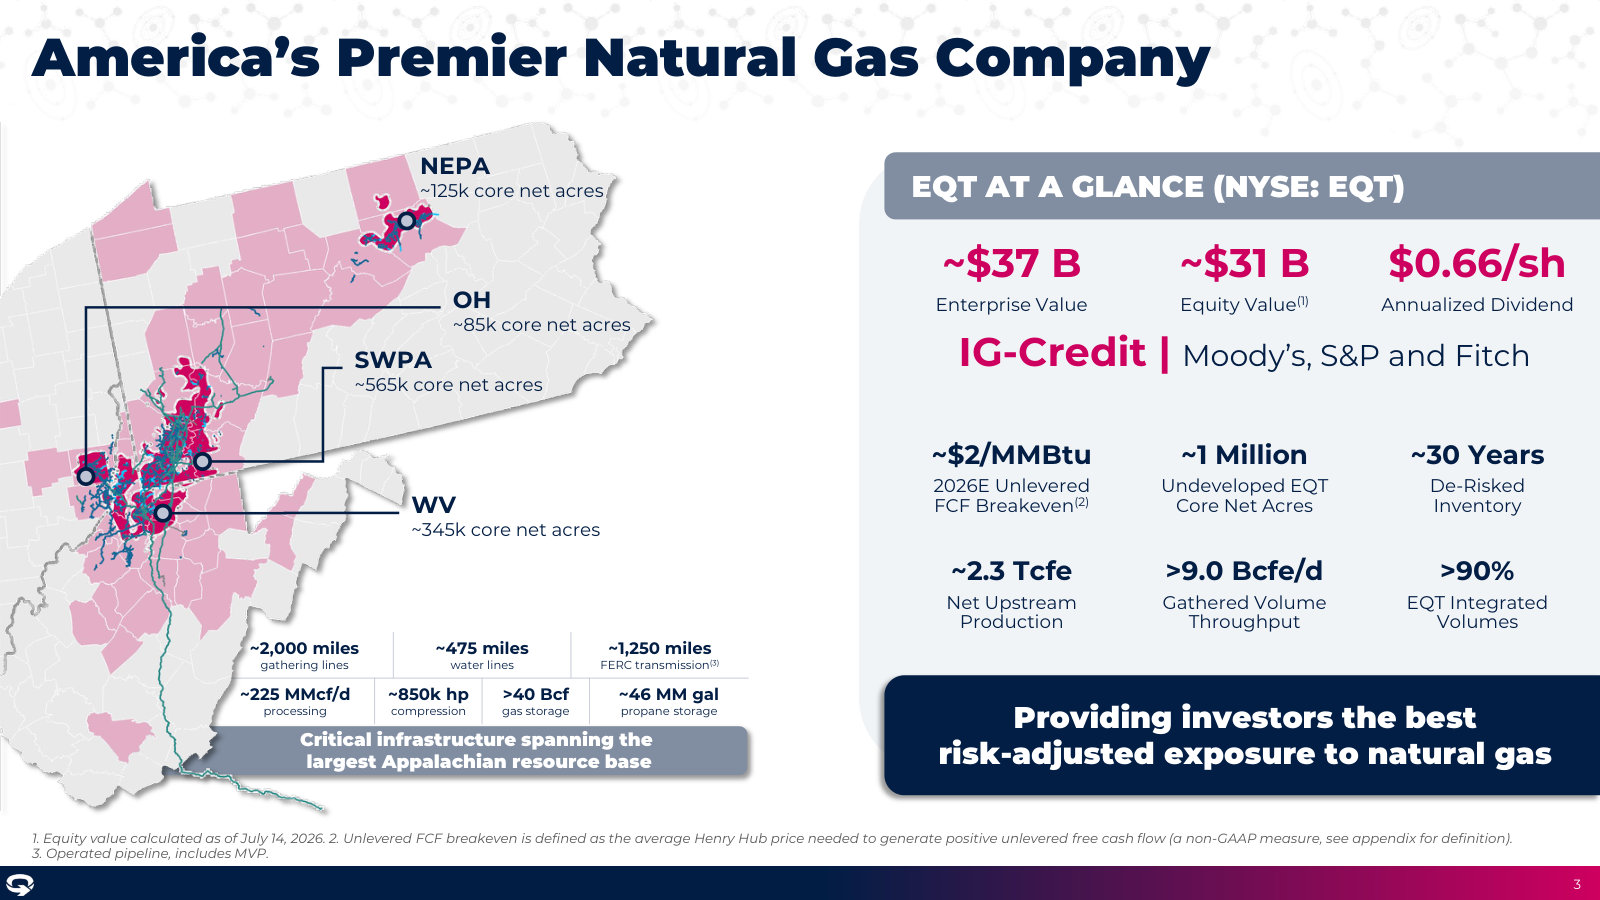
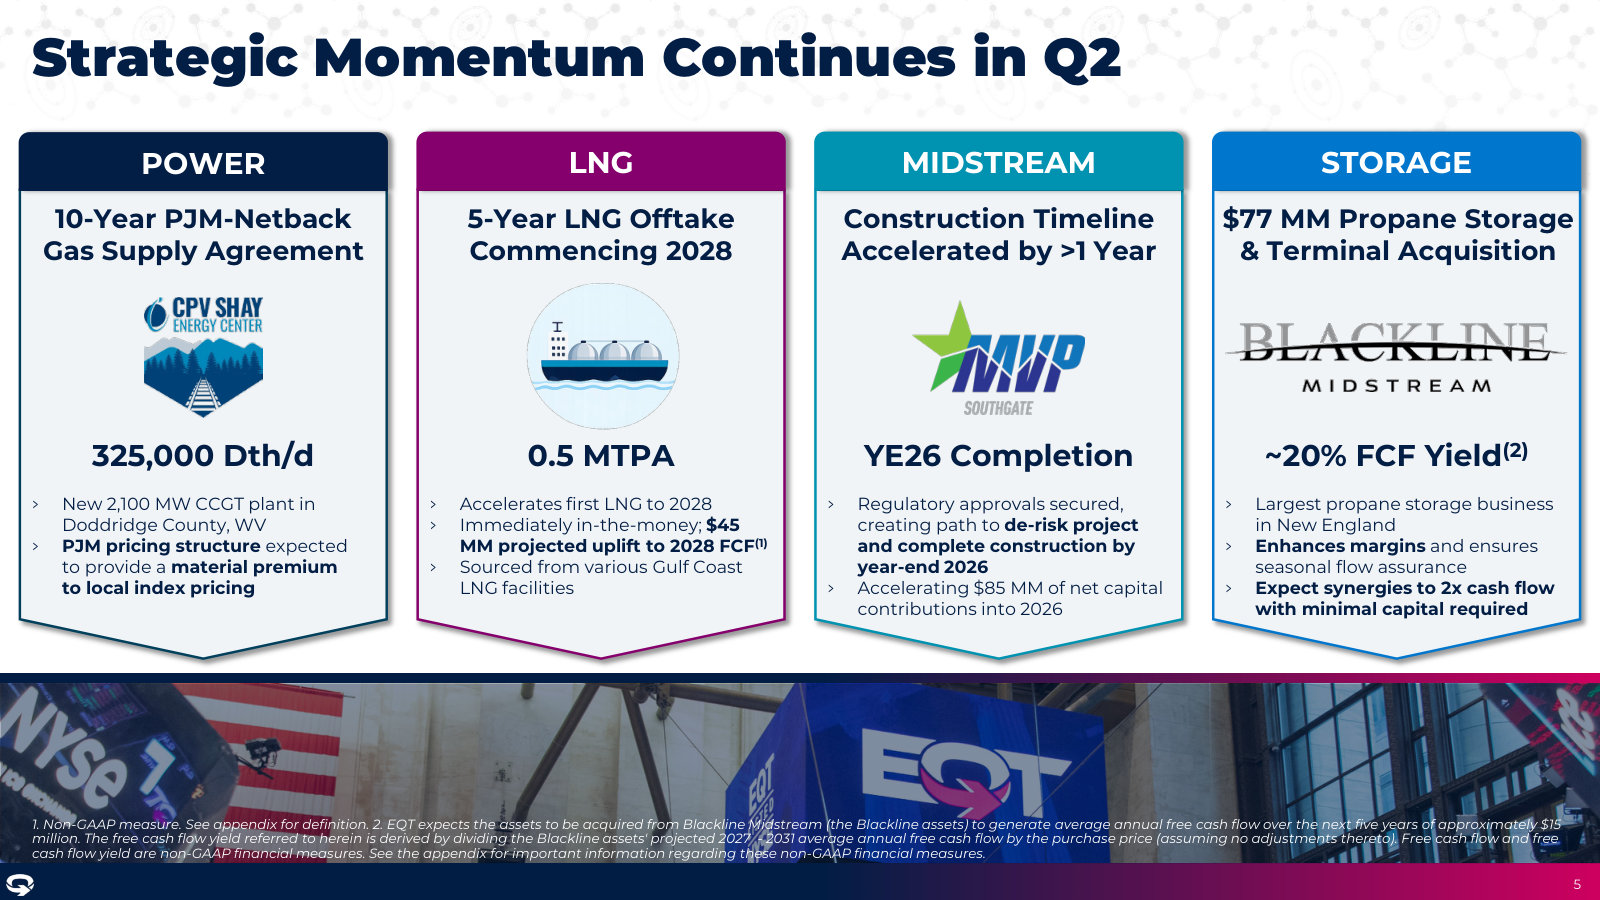
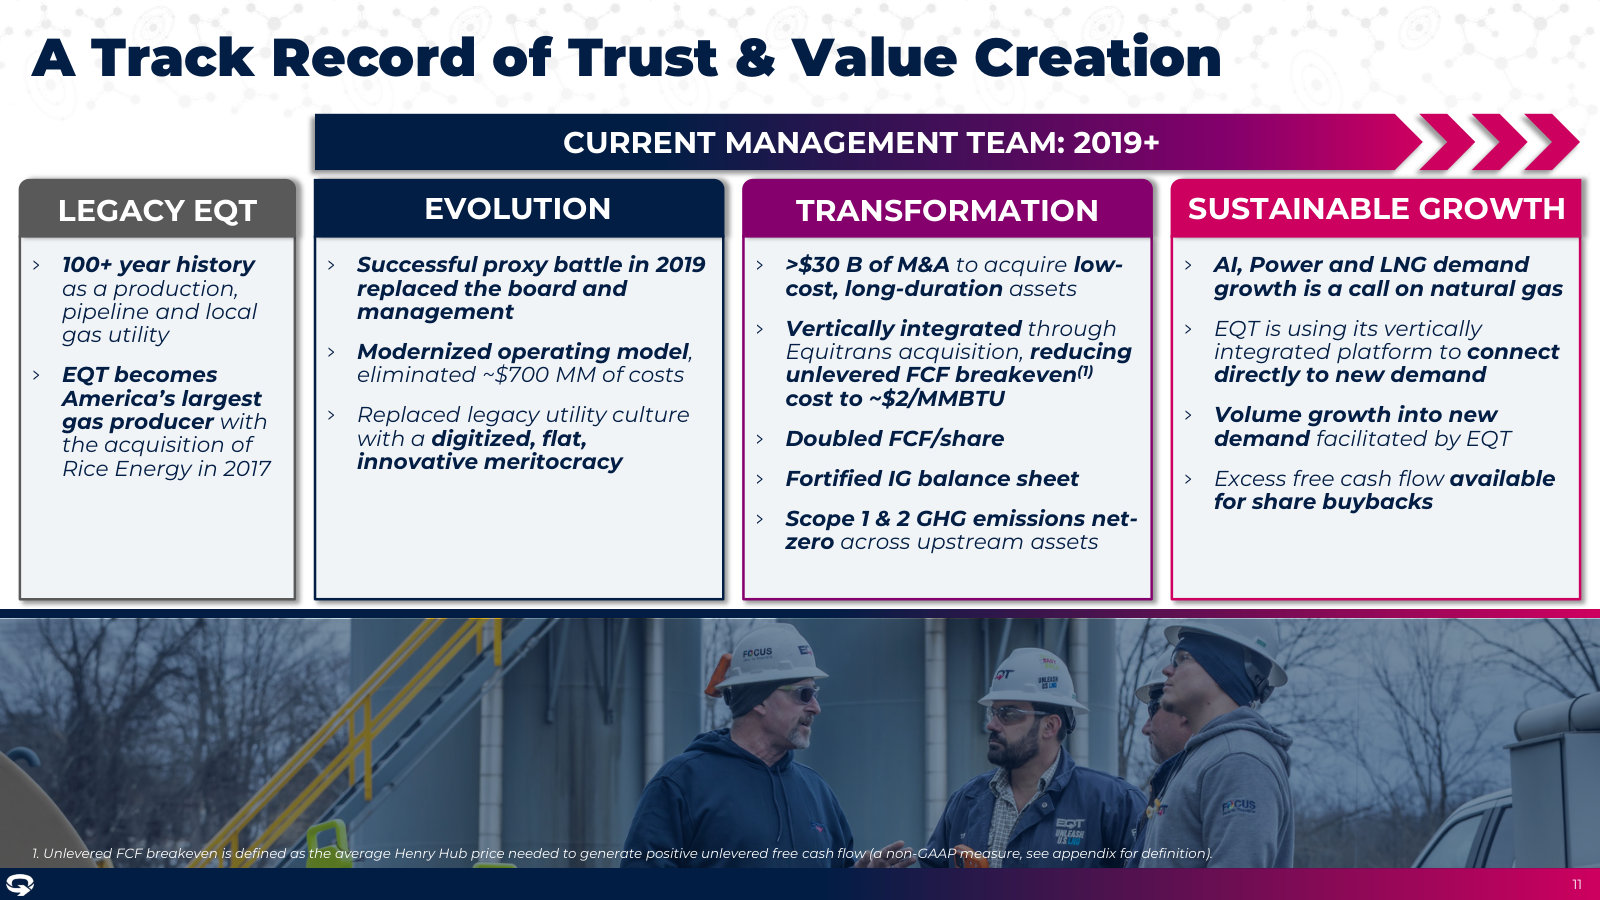
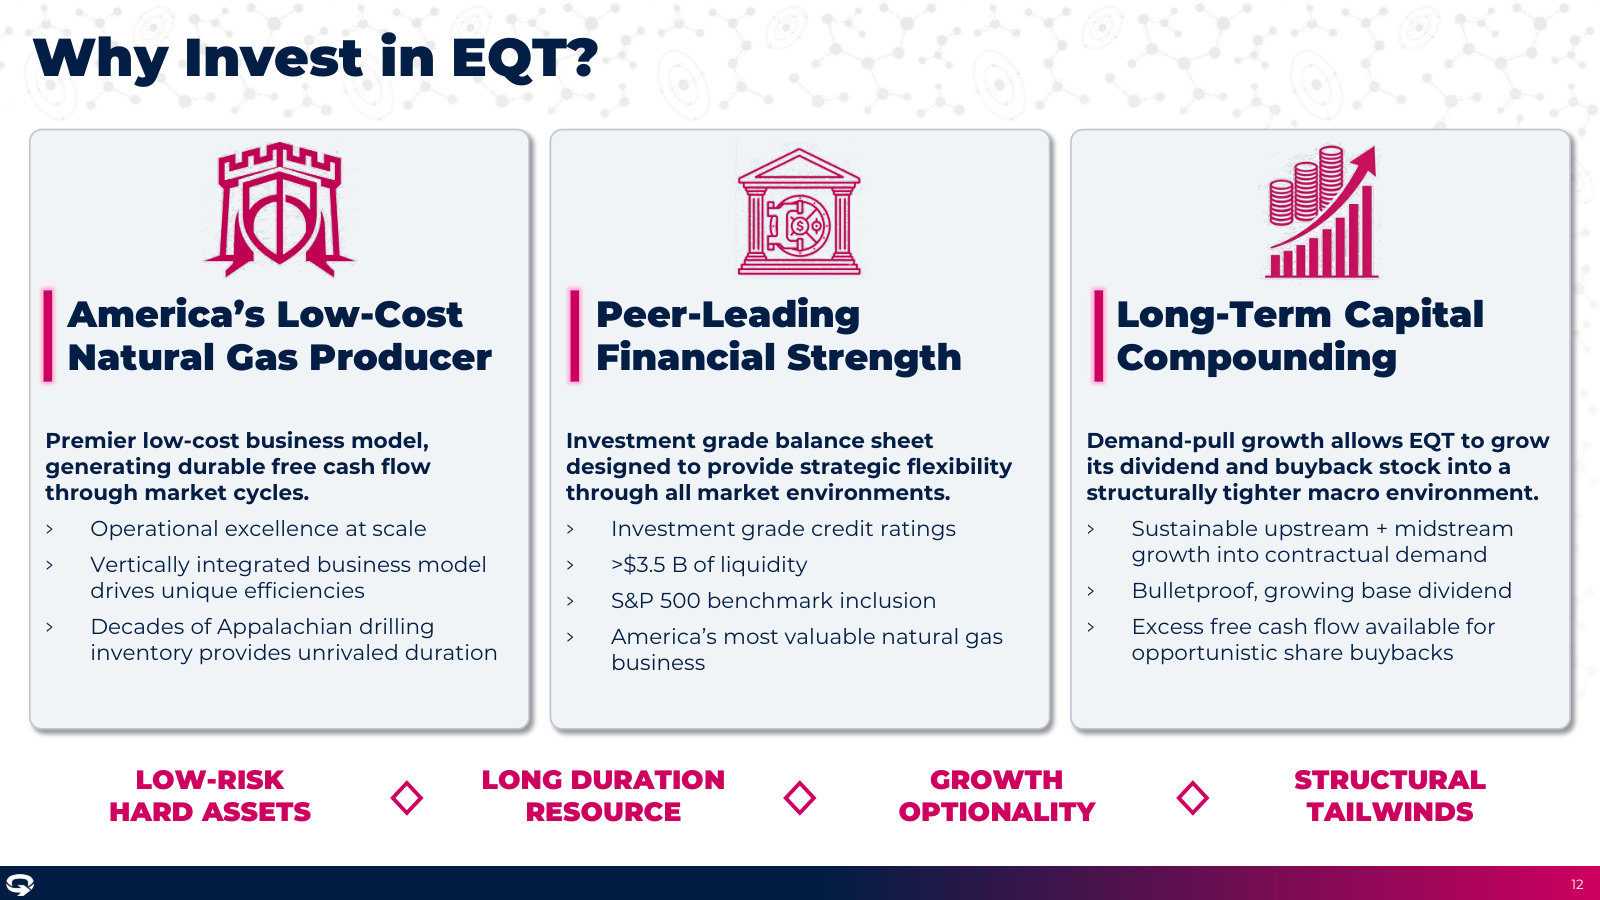
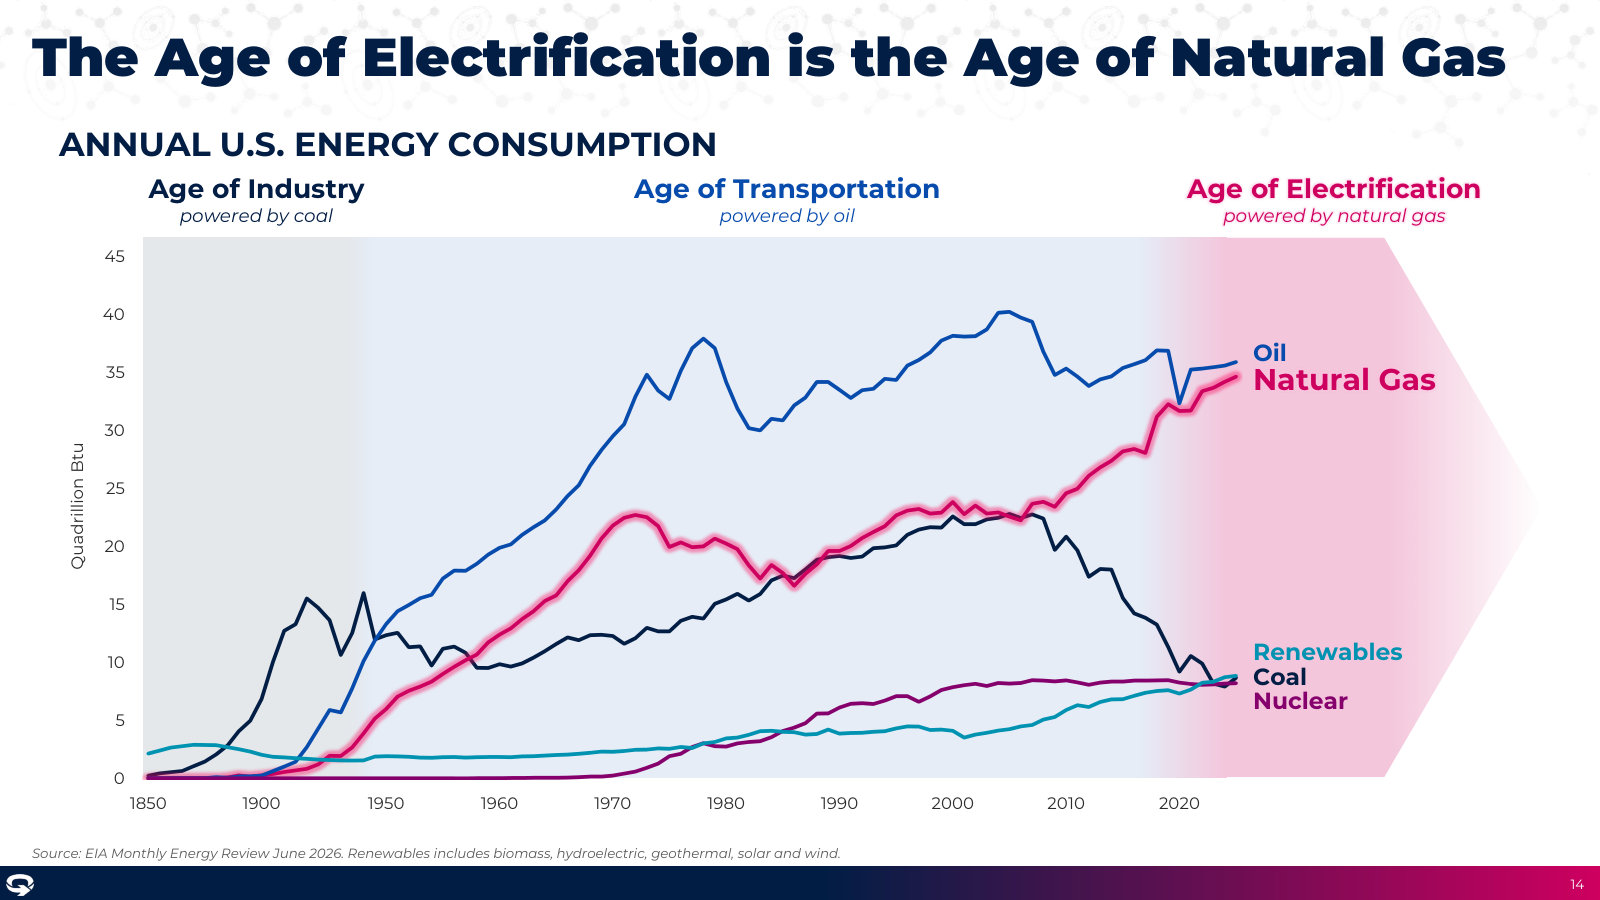
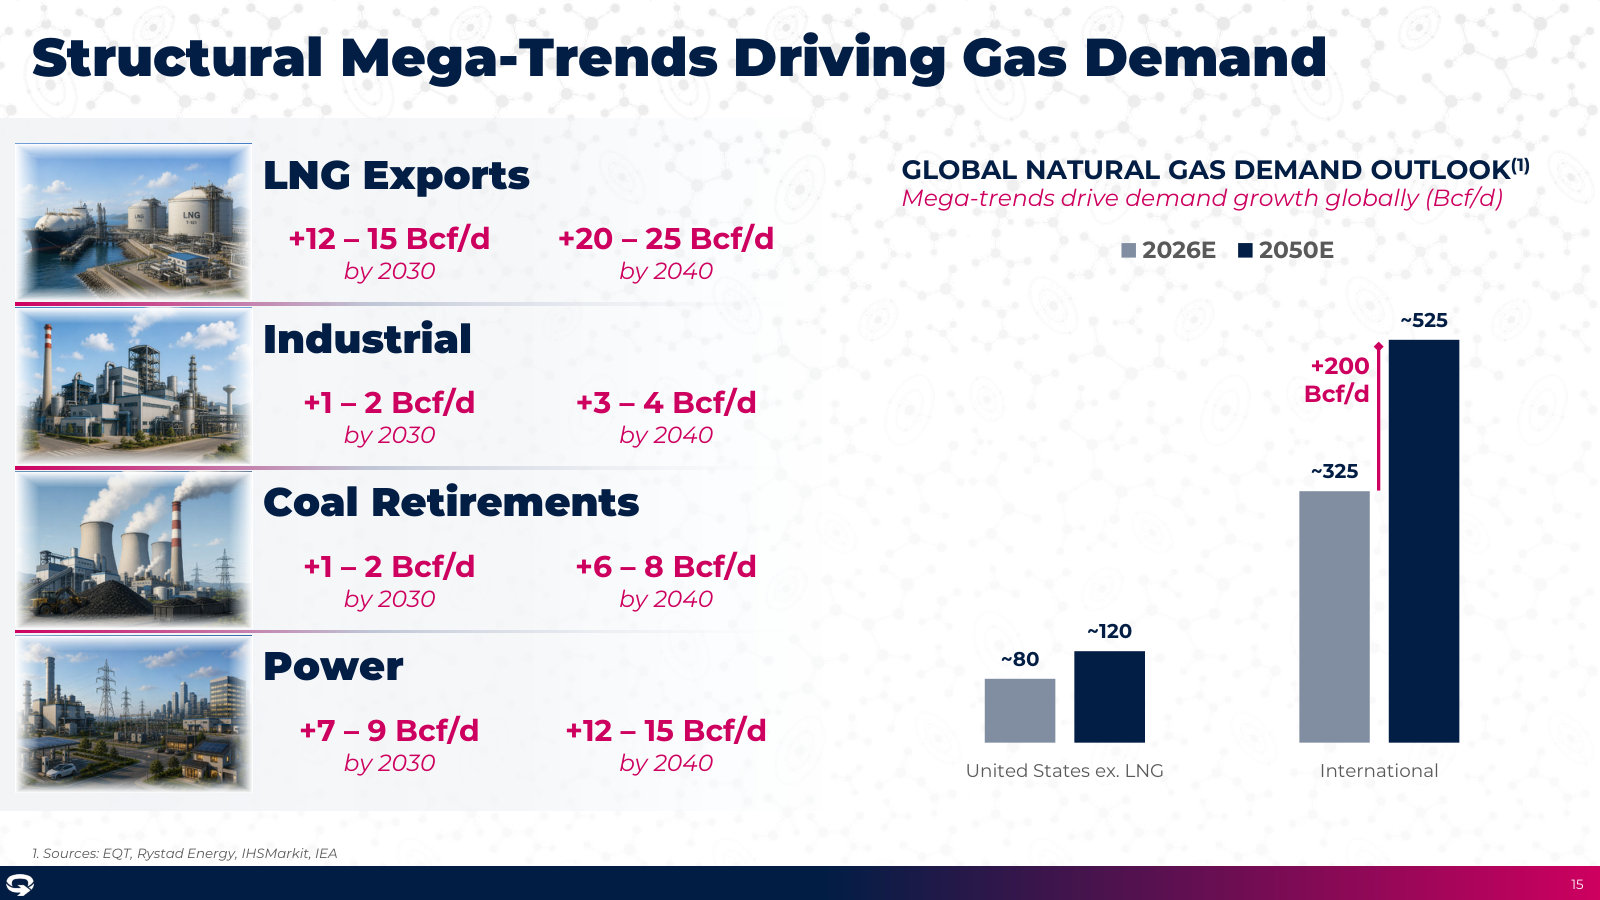
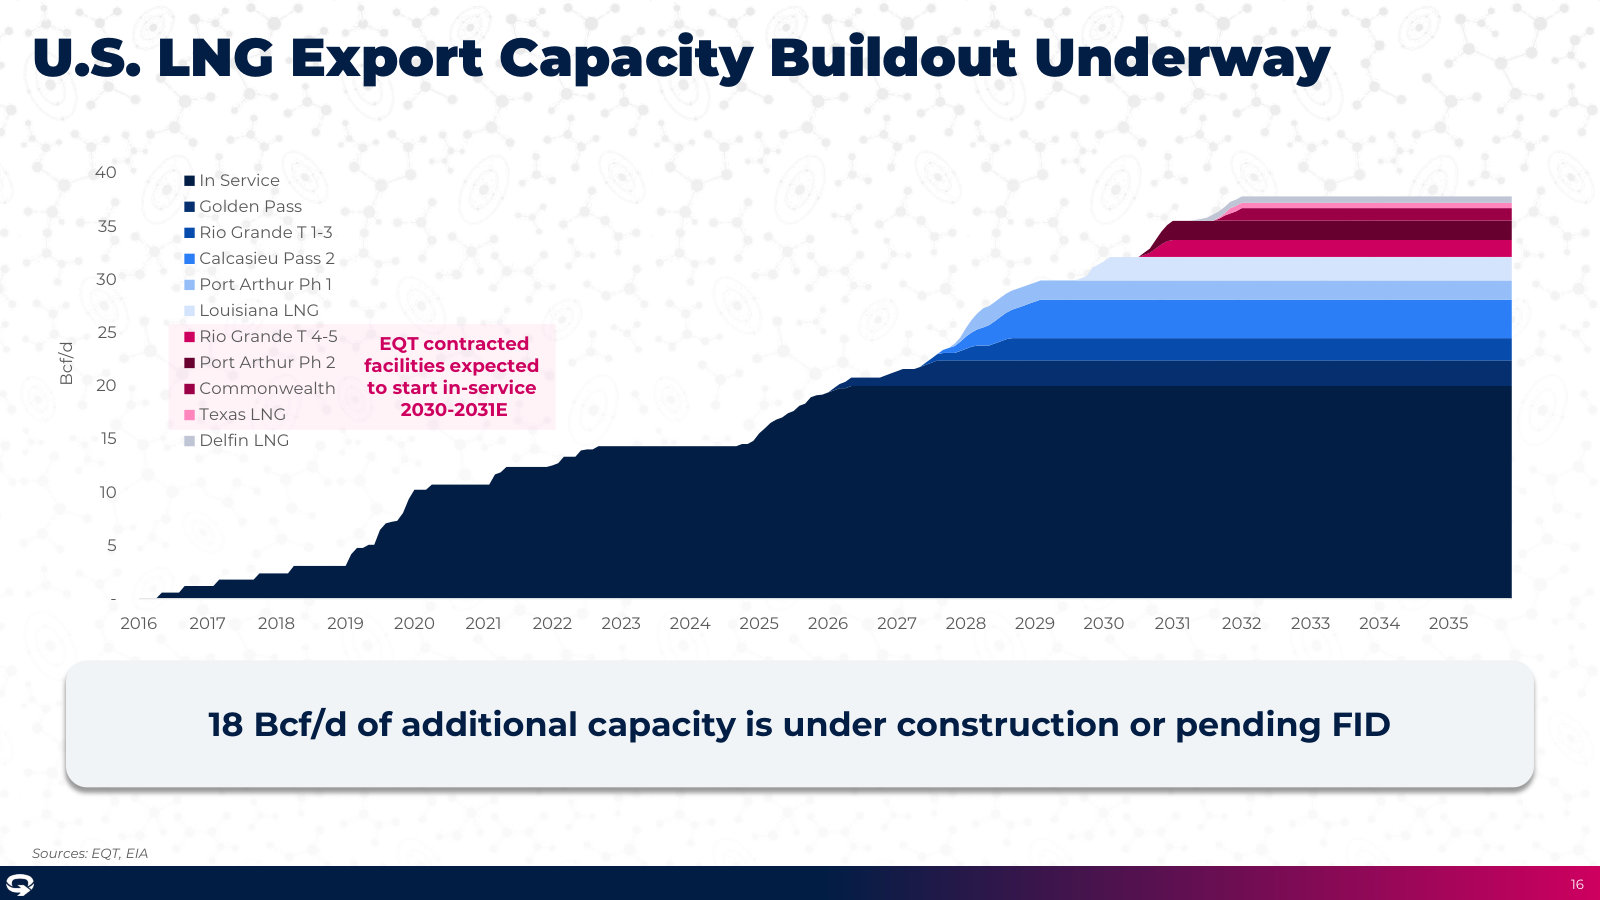
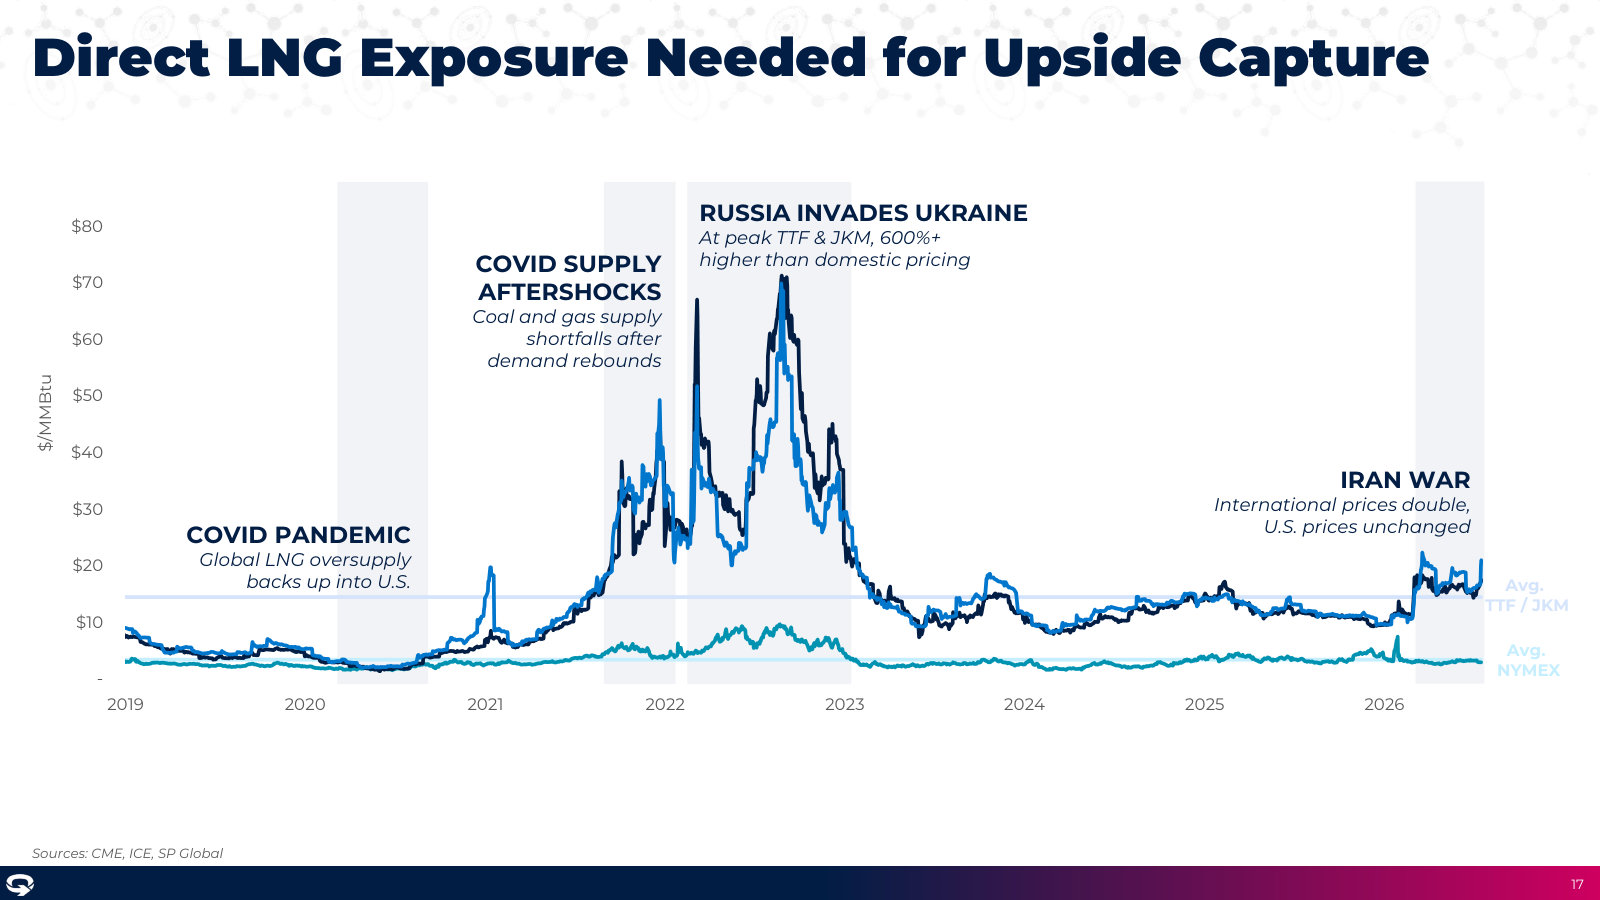
EQT Corporation's management explains the business in its own materials. The slides below do the most of that work, pulled from the documents preserved in Sources. Each source link opens the complete presentation at that slide in a new tab.
Investor Presentation — Q2 2026 Results — Q2 2026
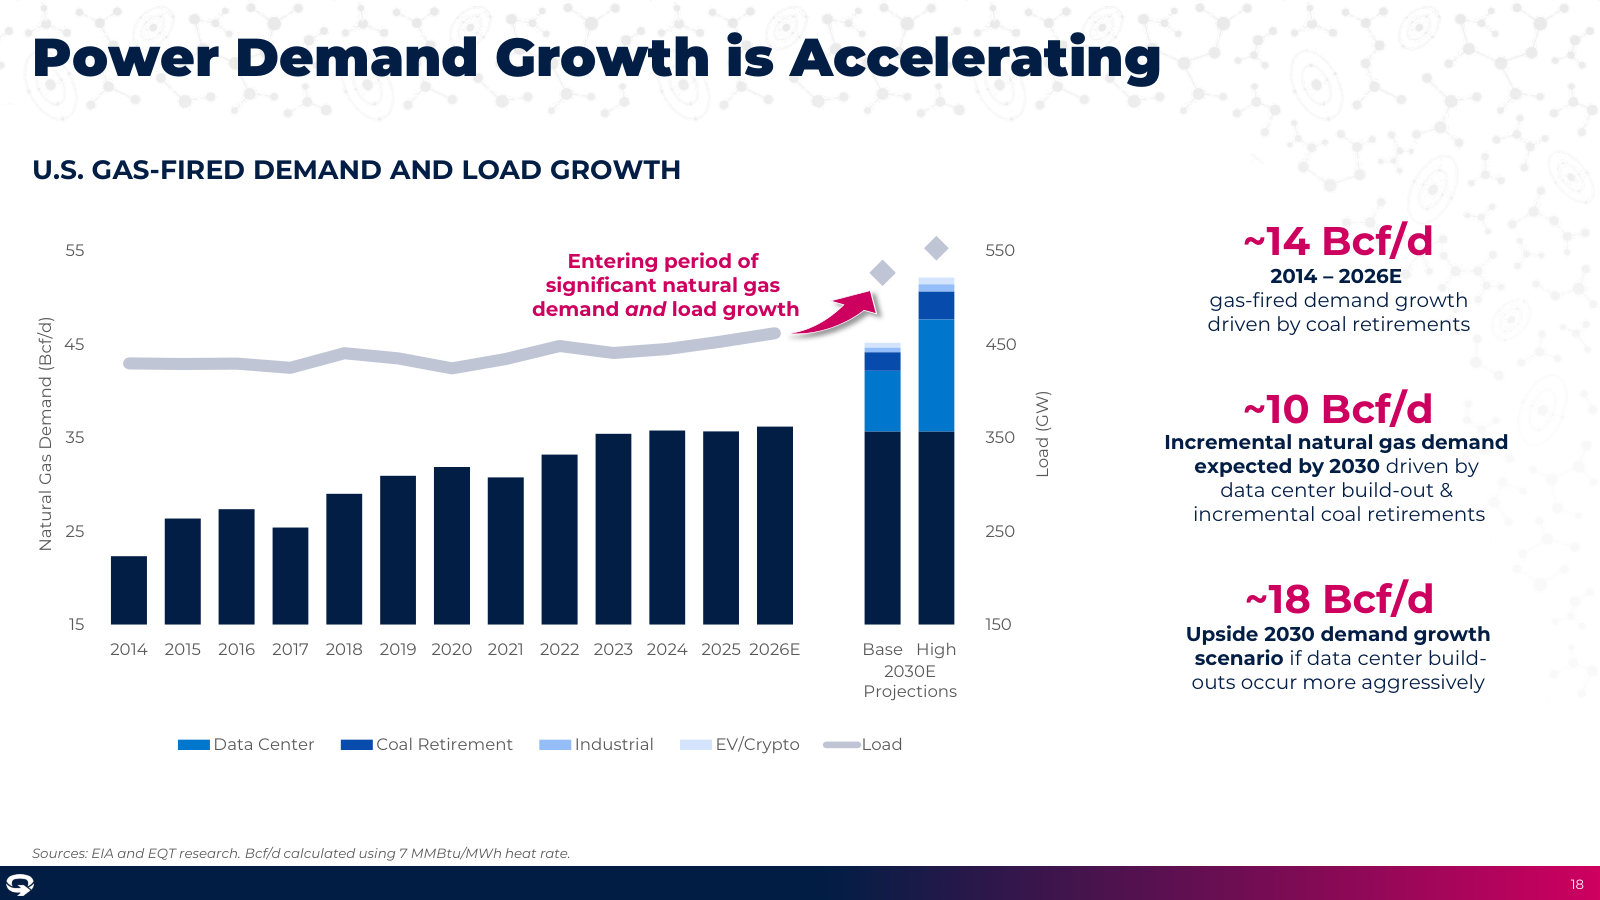
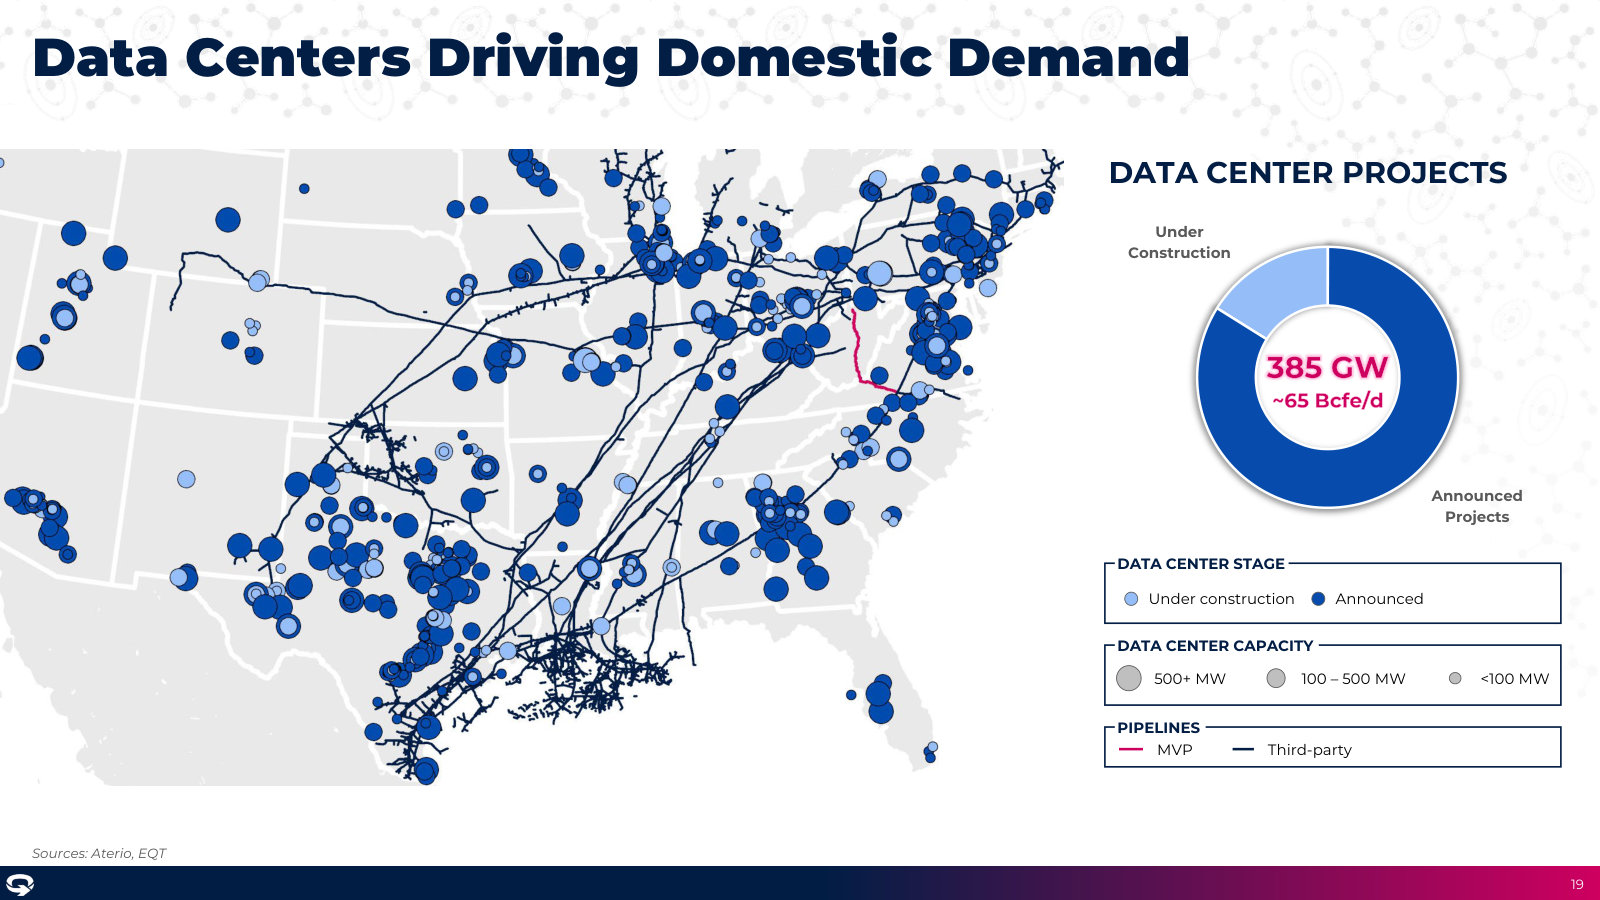
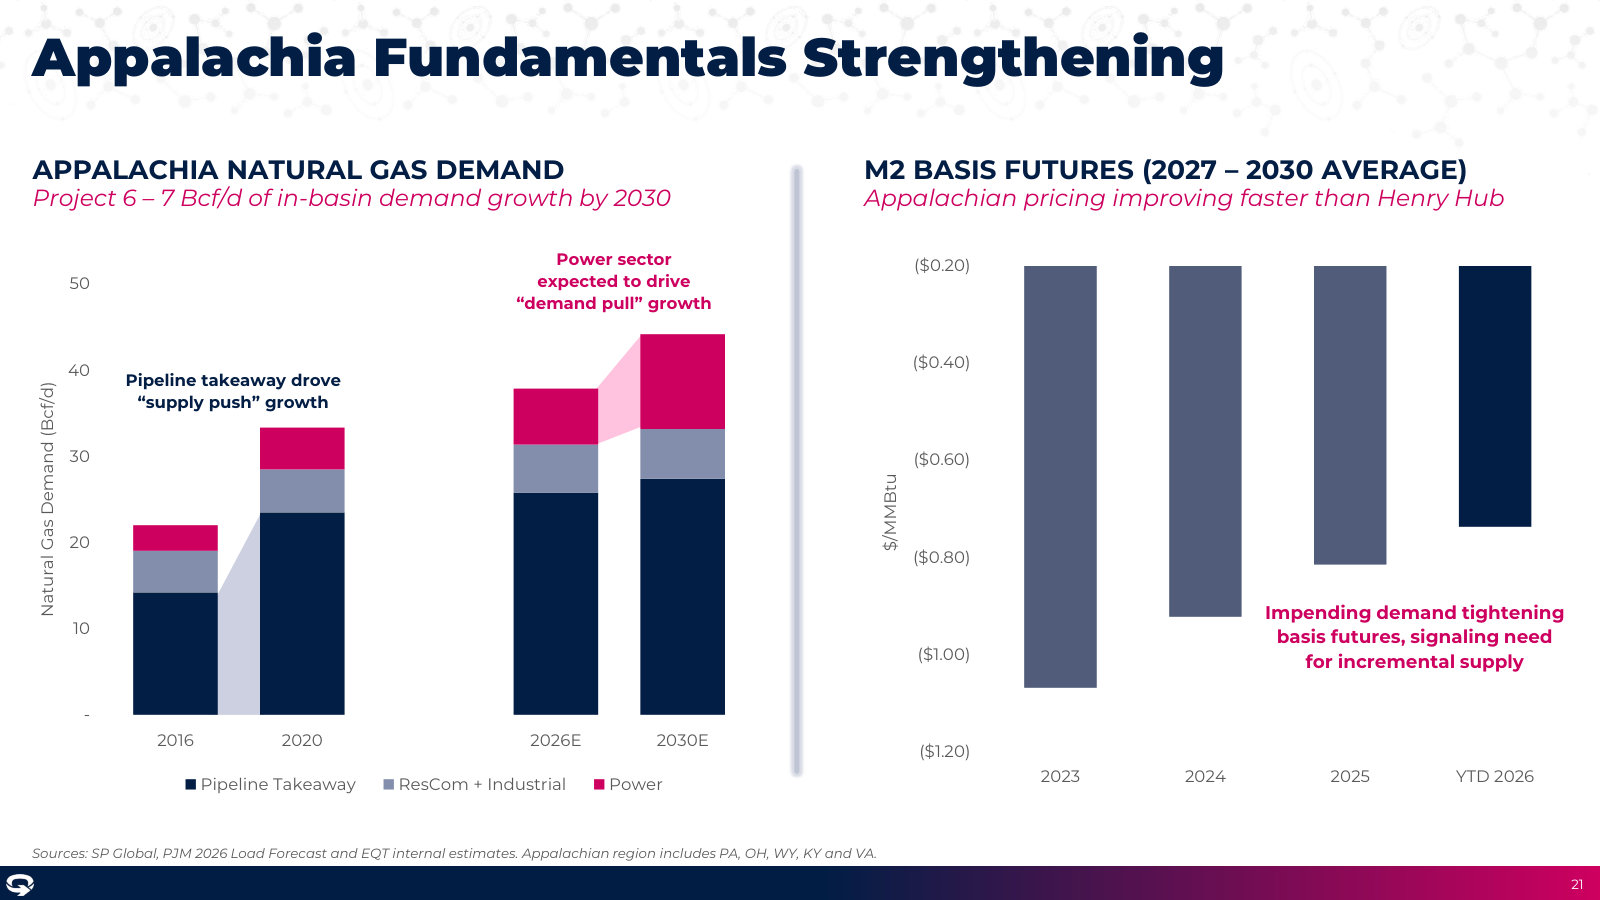
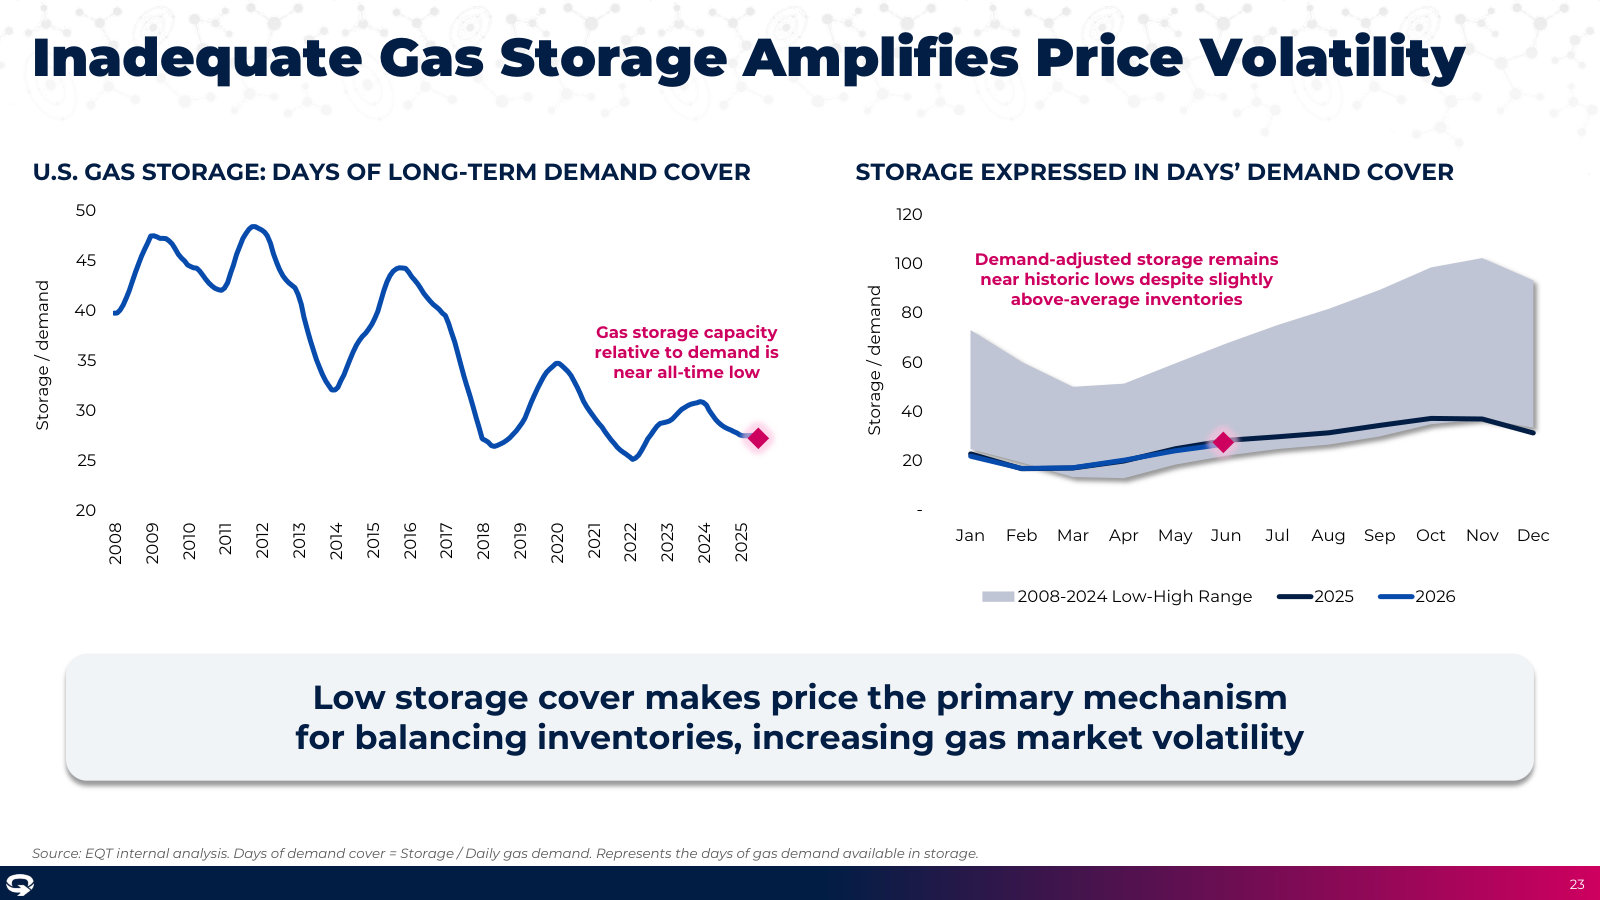
EQT's fullest current deck — the company, the gas-demand thesis, the LNG book and the balance sheet in one place. · Open the full document →
Investor Presentation — Q3 2024 Results — Q3 2024
The first deck after the July 2024 Equitrans close — the clearest account of how EQT became integrated. · Open the full document →
More from management
Investor Presentation — Q4 2025 Results — Q4 2025 · 46 pages · Full-year 2025 results and 2026 guidance, plus the Winter Storm Fern stress test that put the integrated model to work. · Open →
Investor Presentation — Q4 2024 Results — Q4 2024 · 36 pages · The first full year reported as the combined EQT + Equitrans, with the 2025 operating plan. · Open →
Investor Presentation — Q2 2024 Results — Q2 2024 · 37 pages · The deck around the July 2024 Equitrans close — EQT at the pivot from standalone producer to integrated enterprise. · Open →
EQT Corporation's management answers for the business every quarter. These are the exchanges that explain it best — verbatim, from the call transcripts preserved in Sources. Each link opens the full transcript at that page in a new tab.
Q2 2026 Earnings Call — Q2 2026
The current state of the thesis: compression synergies still beating the Equitrans underwriting, power-linked supply deals, and cash building for countercyclical buybacks. · Open the full transcript →
Compression synergies — a core piece of the Equitrans underwriting — keep beating even the upside case.
Toby Rice (President & CEO): This strong operational execution, along with robust well performance, is leading to significant production outperformance, which is evident in our second quarter volumes coming in well above the high end of our guidance. A significant portion of this outperformance is coming from our base production, reflecting better-than-expected results from our midstream compression projects, which are extending flat times on new wells and shallowing base declines on older wells. As a reminder, these projects were a key piece of the synergies we projected when we acquired Equitrans, and they continue to exceed even our upside forecast.
p. 1 · Read in context →
The discipline: no growth for growth's sake — only growth tied to contracted demand that lifts FCF per share.
Toby Rice (President & CEO): We have no interest in growing for growth's sake, as that is a strategy that has historically resulted in poor returns and value destruction in this industry. Instead, our focus remains on growth with durable, contractual demand in a manner that is accretive to corporate returns, expands free cash flow per share, and creates long-term shareholder value.
p. 2 · Read in context →
Capital-allocation endgame: hit the $5B net-debt target, then hoard cash to buy back stock in down cycles.
Jeremy Knop (CFO): Turning to capital allocation, we are on the doorstep of achieving our longterm net debt target of $5 billion, a milestone that represents the culmination of years of commitment towards bulletproofing our balance sheet. During times of turbulence, our balance sheet will become a fortress and cash on hand a strategic tool to fund aggressive share buybacks and long-term growth investments even in low price environments. To that end, in the near term, we intend to accumulate cash, which we plan to aggressively deploy into share buybacks during the industry's episodic down cycles.
p. 3 · Read in context →
The new pricing model: a supply deal indexed to PJM power, not gas — ~$100M/yr and five cents of differential.
Betty Jiang (Barclays); Jeremy Knop (CFO): And Jeremy, a question to you on the CPV contract being linked to power pricing: how do you think about the upside and downside risk around that contract structure? Is there a floor price for EQT to protect you if there is downside risk? […] Great question, Betty. To frame it, hypothetically, if this contract came online for a full year at full capacity it would improve our free cash flow by about $100 million a year and improve corporate differentials by roughly five cents. It is a material premium and a true win for us and the developer. We can hedge it financially if we choose, but electricity and gas prices in PJM are tightly correlated because gas sits in the generation stack and dispatch drives that correlation. As the cost of building new generation continues to rise, we expect the spark spread to widen, creating a stronger market signal for more generation long term. We think being exposed to power pricing is the right bet, and it gives us direct exposure to structural power fundamentals without capital commitment. It is our second deal like this and we would be open to doing more if it is best for the customer. It speaks to the structural creativity of our team to provide solutions across the value chain.
p. 5 · Read in context →
Q4 & Full-Year 2025 Earnings Call — Q4 FY2025 / Full-Year 2025
The annual scorecard and the thesis stress-tested by Winter Storm Fern, plus the clearest statement of how EQT thinks about returns and growth. · Open the full transcript →
Winter Storm Fern as proof: MVP flowed above nameplate while Transco cash spiked past $130 — 'if we build more, America pays less.'
Toby Rice (President & CEO): The cumulative result of our operational outperformance delivered $2.5 billion of free cash flow attributable to EQT in 2025 with NYMEX natural gas prices averaging approximately $3.40 per million Btu for the year. Our free cash flow generation significantly outperformed both consensus and internal expectations, underscoring the power of our low-cost integrated platform and our ability to consistently deliver differentiated shareholder value. Importantly, our ability to deliver wasn't just visible in our financial results. It was demonstrated operationally in one of the most challenging environments in recent times during Winter Storm Fern. I want to take a moment to recognize our upstream, midstream, and marketing teams for their outstanding coordination and execution during the storm. The team's effort helped keep millions of American homes heated and businesses running while also allowing us to capture peak cash market pricing during periods of elevated demand. This is a great example of how EQT's integrated operations, resilient infrastructure, and commercial alignment come together to deliver differentiated value for both our customers and our shareholders. Winter Storm Fern also provides a stark reminder of just how important natural gas infrastructure is to the reliability of the U.S. energy system. During the storm, our Mountain Valley pipeline flowed 6% above its 2 Bcf per day nameplate capacity, which effectively backstopped 14 gigawatts of power generation across the Southeast region or enough energy to heat more than 10 million homes. And yet, even with this capacity flowing full, cash prices at Transco Station 165 spiked to over $130 per million Btu, highlighting a system that remains structurally constrained. These price signals are unmistakable. The country needs more pipeline infrastructure and a permitting framework that allows the industry to get back to building critical infrastructure again. Expanding natural gas infrastructure isn't optional. It's essential to delivering reliable, affordable energy to U.S. consumers and support long-term economic growth. However, when supply is constrained due to lack of infrastructure, prices rise and affordability suffers. Luckily, the solution is simple. We need to get back to building and connecting low-cost natural gas supply to the demand centers that need it most. Simply put, if we build more, America pays less.
p. 2 · Read in context →
Why the integrated model is 'anti-fragile': the trading desk selling MVP gas at $130 because ops give it real-time visibility.
Neil Mehta (Goldman Sachs); Jeremy Knop (CFO): Yes. Neil, I would add to that, too. I mean, our commodities team is focused on two things primarily. First, focused on balances or really minimizing imbalances is probably the best way to put it. And that really comes down to extreme coordination with our operations teams and our control centers to make sure that we know exactly how much volume is coming into th system so we can keep our sales in balance. The second is arbitrage capture. A really good commodities team is not able to focus on things like arbitrage capture if they're constantl trying to figure out where volumes are. And during winter events like storm, when our operations teams are delivering and we have good visibility into both the midstream operations and upstream operations, they're able to dedicate their time to capturing that opportunity. But I mean, look, some of the trades that we executed during the end of January and early February were, I mean, absolutely outstanding, making sure volumes got to where they needed to be, shutting down all of our Gulf capacity and reselling it in basin when prices were $30, $45, making sure we had full deliverability through our MVP capacity, selling it at $130 MMBtu for certain days, making sure that we have confidence in the volumes that will show up in February and being able to nominate at levels like we did at 98%, which is probably an all-time high for EQT. But again, when we see the opportunity to sell gas on a month-forward basis in the mid- to low 7s or to sell into Station 165 at over $11 for a month, you have to be able to depend on your operating teams to do that and capture the value presented. And that's what we're able to do uniquely at EQT through the platform we've put together.
p. 6 · Read in context →
Growth philosophy: respond to contracted demand, not price signals — likely ~3% CAGR, buy back stock in downturns.
Francis Lloyd Byrne (Jefferies); Jeremy Knop (CFO): Lloyd, I want to add that when we reflect on our industry over the last ten to twenty years, a significant portion of growth has stemmed from companies irresponsibly pursuing short-lived price signals. As we consider growth, we return to those three prerequisites I mentioned earlier. We don’t plan to announce that we will simply grow over the next year, nor do we believe that higher prices will lead to a slight increase in volume. This approach doesn’t reward any company; it introduces uncertainty and resembles gambling on prices. Our perspective is that when there’s a consistent demand emerging, like the MVP projects launching such as the Clarington data centers, this represents a stable demand of several Bcf a day that we are committed to supporting. If we do grow, it would likely resemble a 3% growth rate over the next five years on a compound annual growth rate basis. We have a strong business model, a sound balance sheet, a robust cost structure, and an integrated platform that enables us to achieve this regardless of the broader economic conditions. As an investor, this allows you to rely on our growth rather than worrying about fluctuating capital investments based on market prices. In the event of a downturn while we are in this long-term growth phase, we would buy back stock during the decline and reduce volumes during weaker periods, but we wouldn’t alter our operational pace. This positions us uniquely compared to other companies that have discussed growth, as they do not possess the capabilities we have developed. Therefore, when we do pursue growth, it will be deliberate, disciplined, and focused on the long term, without chasing after transient price signals.
p. 10 · Read in context →
The framework that explains the whole strategy: return on shareholder capital, not single-well IRR — why EQT skipped the Haynesville.
Nitin Kumar (Mizuho); Jeremy Knop (CFO): Yes, Nitin, we are focused on the returns on shareholder capital. Many traditional upstream companies tend to focus overly on metrics like single well IRRs, which are not directly comparable to what generates stable cash flow streams for investors. These cash flows contribute to free cash flow and free cash flow yields. When drilling a well that achieves a 100% IRR, the return on your enterprise value should equal your WACC; this is typically a 10:1 ratio. Therefore, to achieve a 10% return on enterprise value, you likely need a well return of about 100%. Companies claiming a 15% wellhead return breakeven might actually be providing only a 1% return for shareholders relative to their WACC, which is not logical. This aspect is often overlooked. We need to consider infrastructure cash flows, which are similar to annuities. The capital we invest yields recurring cash flows over the long term. If our average yield on enterprise value is around 10%, but we also invest in projects that generate 20% to 30% cash flow yields, we create real sustainable value for shareholders, even if the headline IRR is different. For instance, to achieve the same investment multiple from drilling a Marcellus well as opposed to a Haynesville well, the Haynesville well would need double the IRR. The steep decline in Haynesville wells complicates that comparison. As a result, we don't emphasize IRR significantly; it's not the right metric for us. Our main concern is how we can sustainably uplift cash flow for shareholders. Reflecting on our infrastructure investments, such as acquiring Equitrans, reveals that we have consistently focused on this foundational insight. This is also why we avoided entering plays like the Haynesville. When people look at our stock and note that we trade at a higher multiple than peers, it’s true that we did so a couple of years ago. However, we've outperformed nearly every peer since then while maintaining a similar trading level. It’s important to dissect this to fully understand where our value originates and why.
p. 12 · Read in context →
Q3 2024 Earnings Call — Q3 2024
The first call after Equitrans closed — vertical integration turns from a slide into real synergies, and the curtailment engine gets its clearest explanation. · Open the full transcript →
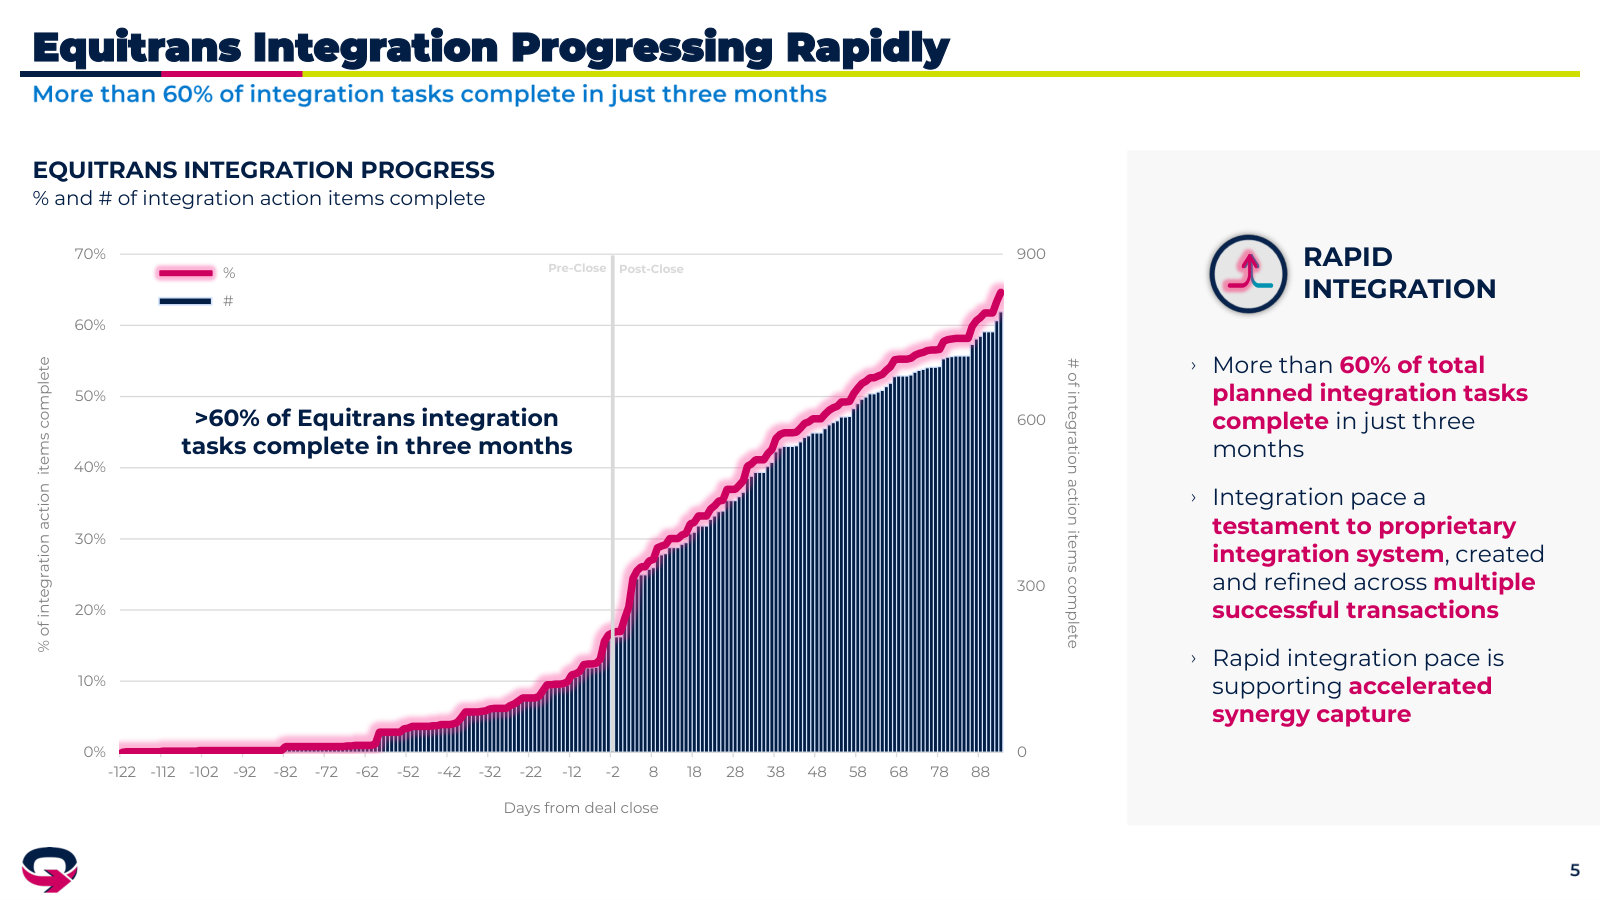
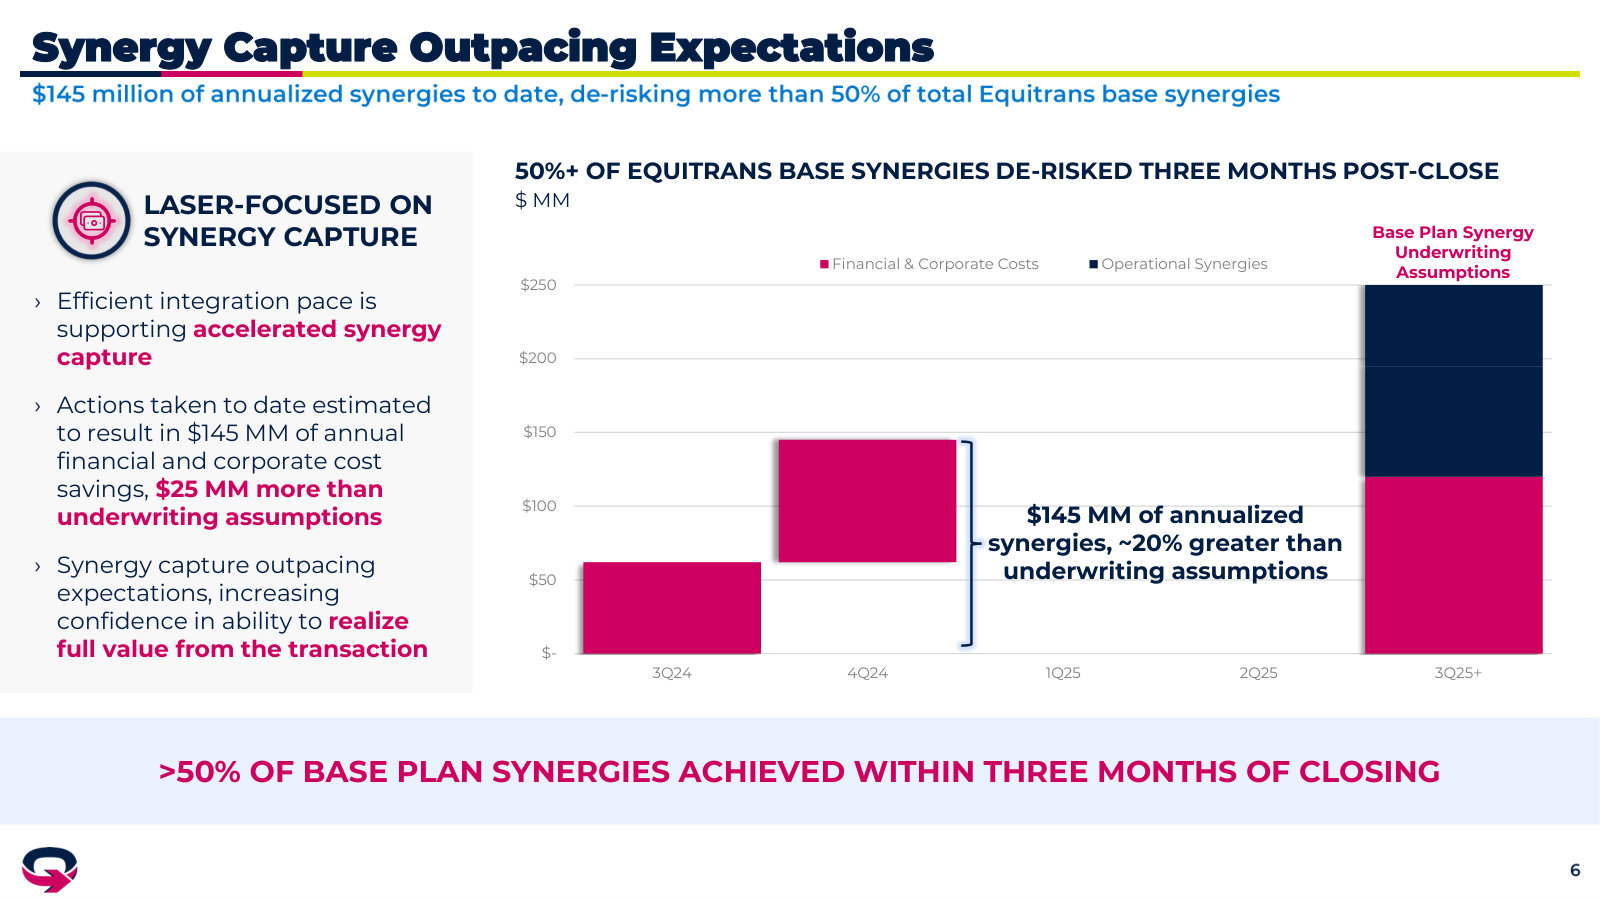
Deal closed: 60% integrated in three months and over half of the $250M base synergies already de-risked.
Toby Rice (President & CEO): The third quarter was hallmarked by the closing of our strategic acquisition of Equitrans Midstream, which transformed EQT into America's only large-scale vertically-integrated natural gas business. This combination has created a differentiated business model among the energy landscape, one that has leading inventory duration at the absolute low end of the North American natural gas cost curve. EQT's position as the lowest cost producer structurally derisks our business in the low parts of the commodity cycle while simultaneously unlocking unmatched upside to higher price environments by eliminating the need to defensively hedge longer-term. We believe these characteristics position EQT to generate disproportionate value for our shareholders regardless of where we are in the commodity cycle. […] Since we closed the Equitrans acquisition, our integration team has been sprinting ahead with more than 60% of total integration tasks completed in just three months. This remarkable pace is a testament to our proprietary integration system which has been honed across multiple successful transactions over the past several years. The highly efficient integration pace we've seen to date is resulting in synergy capture occurring quicker than we originally expected. Recall, we had previously assumed base synergies would start accruing by the middle of 2025. But with our integration progress to date, we have already achieved $145 million of annualized financial and corporate cost savings which is $25 million more than our original underwriting assumptions. Said another way, we have already derisked more than half of our $250 million base synergies in just three months of owning Equitrans.
p. 1 · Read in context →
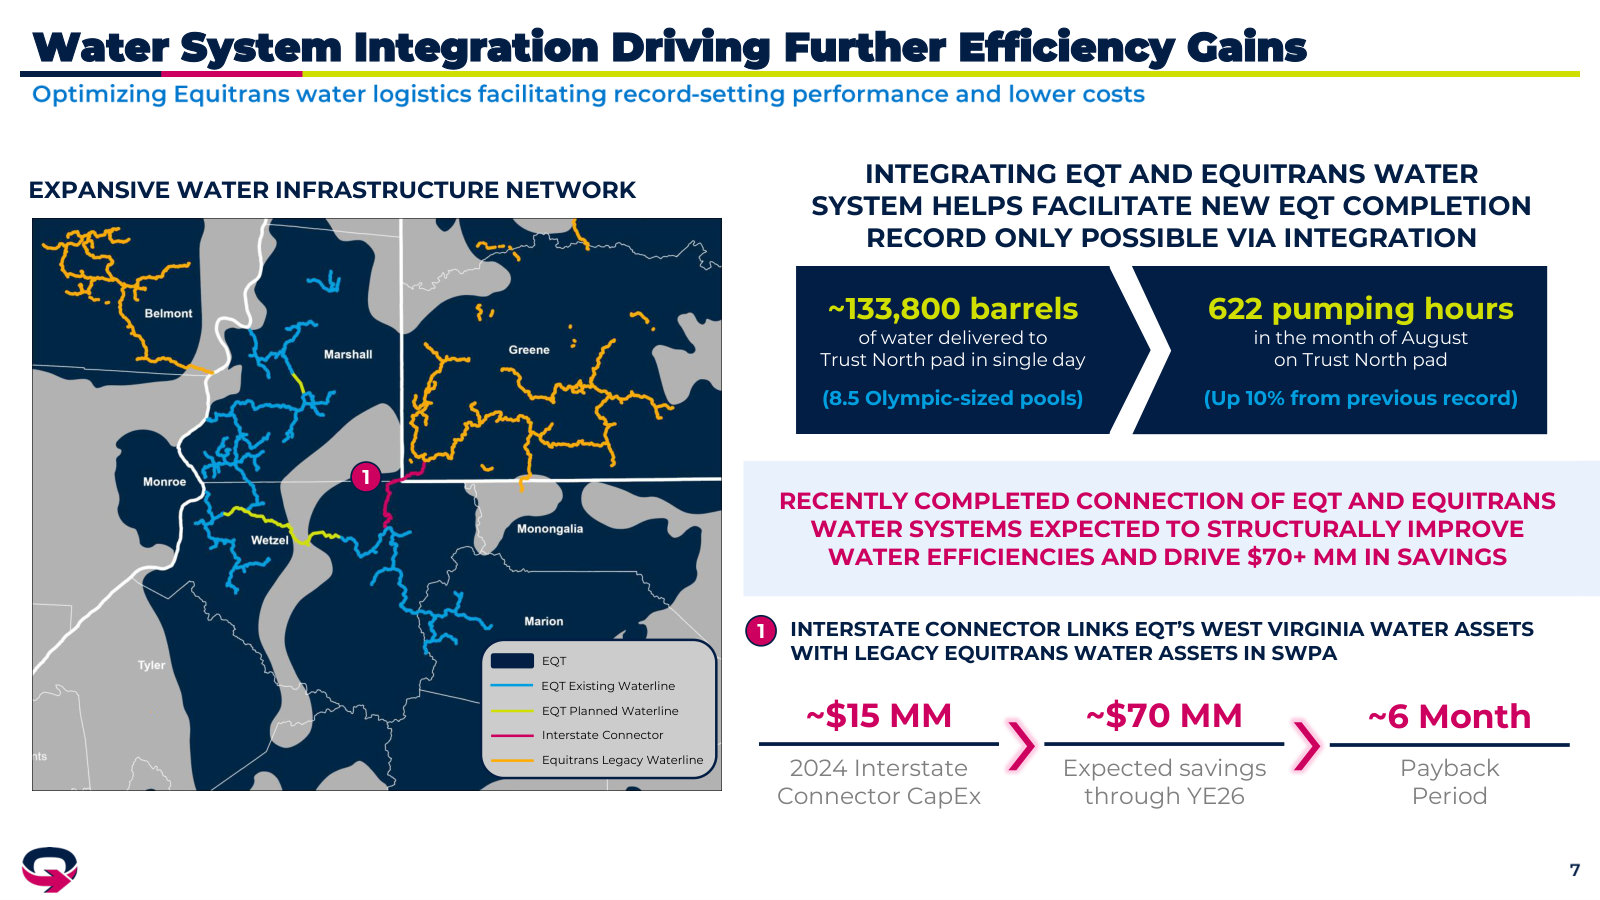
A concrete synergy: connecting the WV and PA water systems saves >$70M for a $15M spend.
Toby Rice (President & CEO): We also recently completed the connection of EQT's water network in West Virginia with Equitrans water system in Pennsylvania, which structurally improves our ability to deliver water to well sites. This connection should also save more than $70 million in water disposal costs over the next two years from an investment of just $15 million, providing an example of the type of low-risk, high-return investment opportunities unlocked by the acquisition.
p. 1 · Read in context →
What integration bought: 4 Bcf/d of minimum-volume commitments gone, so EQT can idle gas instead of slashing activity.
Jeremy Knop (CFO): The acquisition of Equitrans gives us greater ability to deploy this strategy as it eliminated 4 Bcf per day of minimum volume commitments while simultaneously lowering our cost structure to a level that we can maintain steady operations even in the low parts of the commodity cycle rather than being forced to slash activity due to high operating leverage.
p. 3 · Read in context →
Q1 2024 Earnings Call — Q1 2024
Where the entire thesis is laid out: the Equitrans deal, a ~$2 breakeven north star, and the hedging pain that motivated it all. · Open the full transcript →
The pitch: Equitrans makes EQT the first vertically integrated large-scale gas producer at a ~$2 breakeven, $0.75 below peers.
Toby Rice (President & CEO): Last month, we announced our agreement to acquire Equitrans Midstream, a transaction that will transform EQT into America's first vertically integrated large-scale natural gas business. As we described in our conference call last month, this deal catapults EQT to the absolute low end of the North American natural gas cost curve, providing free cash flow durability in the low parts of the commodity cycle while simultaneously unlocking unmatched price upside by mitigating defensive hedging needs, thus providing investors with peer-leading risk-adjusted exposure to natural gas prices. This combination is anticipated to drive our long-term free cash flow breakeven price to approximately $2 per million BTU, which is $0.75 below the peer average and $1.50 below the marginal cost of supply in the Haynesville. This gap between EQT and both average and marginal natural gas producers is a sustainable advantage, which is rare to find among any commodity business and ensures EQT is best positioned to create through-cycle value for shareholders while other producers are forced to either chase commodity prices or defensively hedge a significant amount of production, thus limiting the ability to capture value in the up cycle.
p. 1 · Read in context →
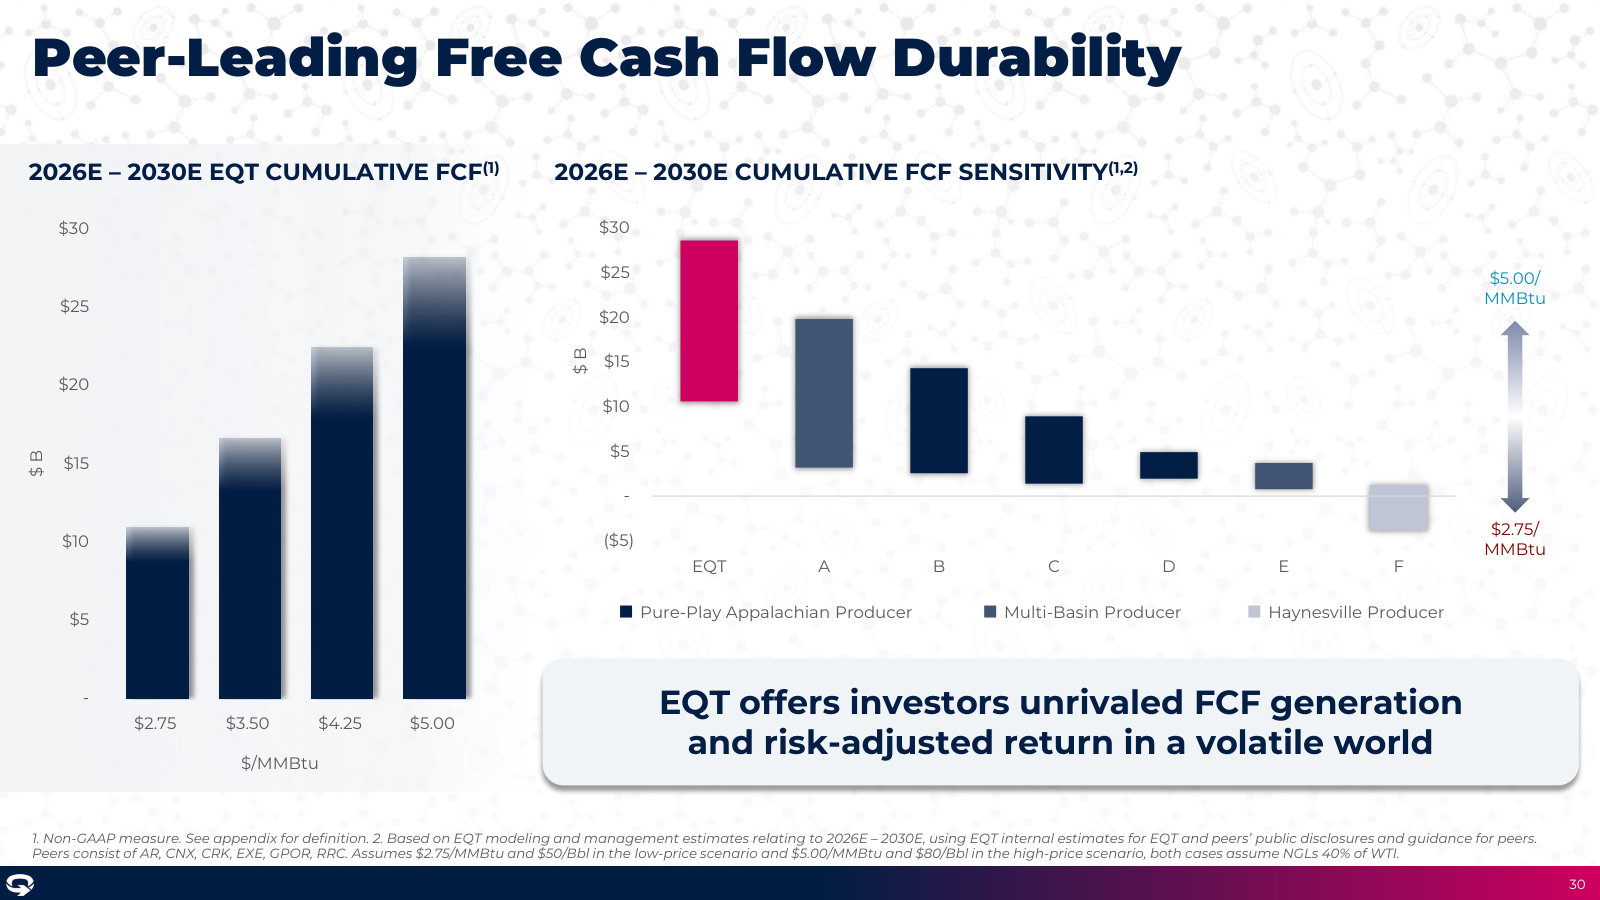
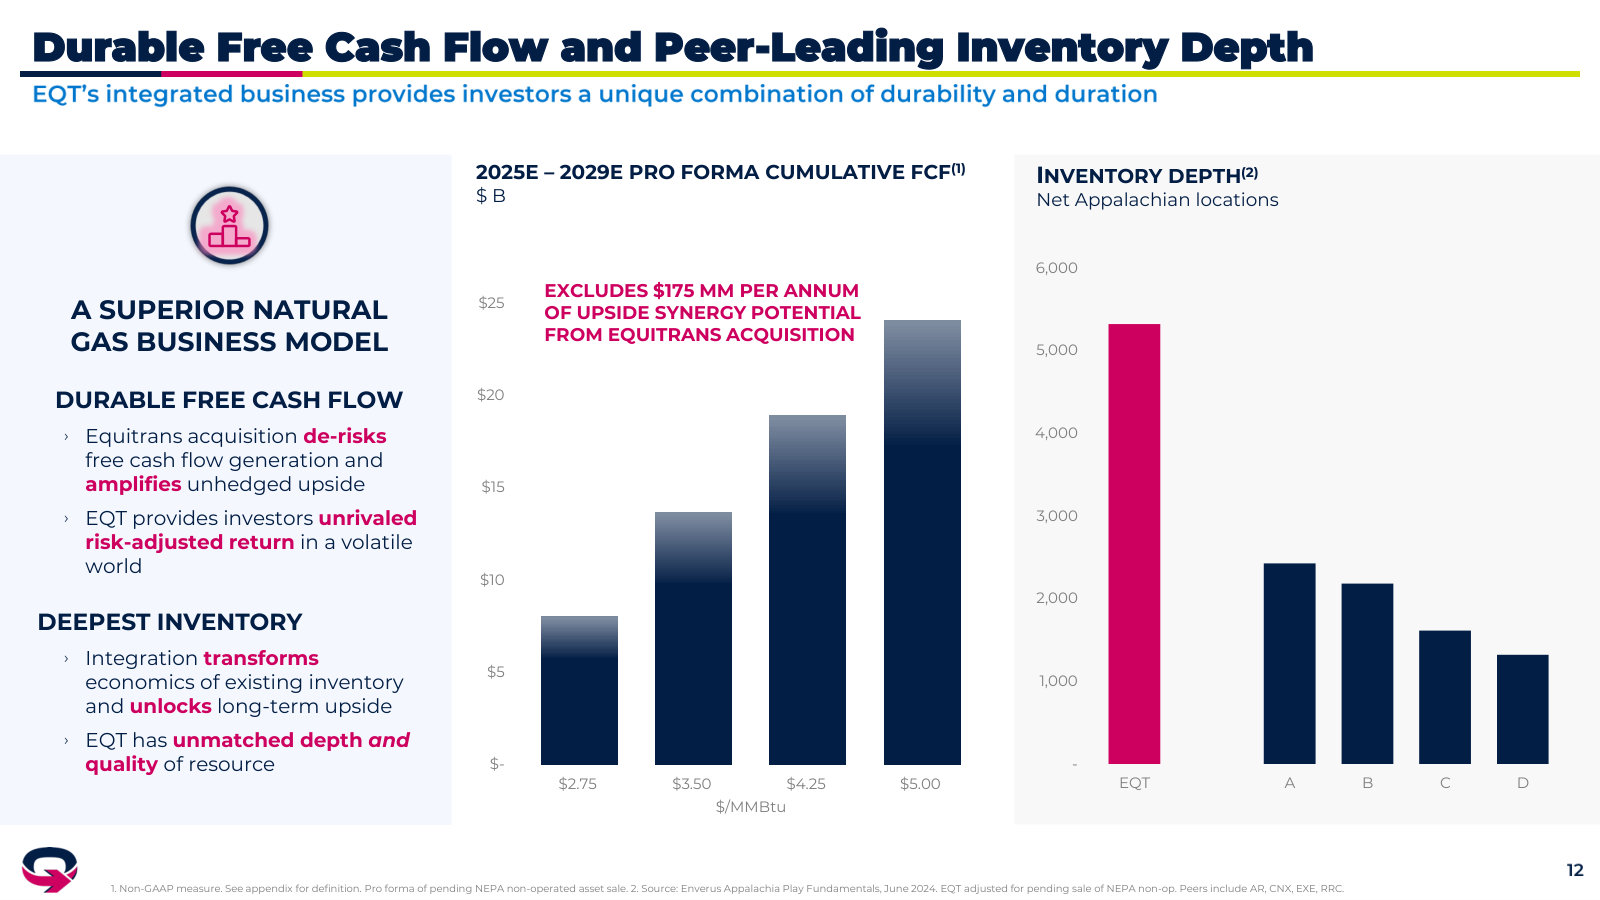
The economics: ~$0.70/Mcfe cost improvement drives ~$8B of five-year FCF at $2.75 gas while most peers go negative.
Jeremy Knop (CFO): In summary, we expect the transaction to drive a pro forma unlevered cost structure improvement of approximately $0.50 per Mcfe. Base synergies equate to approximately $0.12 per Mcfe and upside synergies provide a further $0.08 improvement. So the cost structure benefits to EQT from the Equitrans deal could total approximately $0.70 per Mcfe over time. That is a monumental impact. The advantage arising from this cost structure improvement is evident on Slide 10 of our investor deck, where we show cumulative 2025 to 2029 free cash flow for pro forma EQT and natural gas peers at gas prices ranging from $2.75 to $5 per MMBtu. EQT's pro forma free cash flow durability is peer leading at $2.75 natural gas prices as we project approximately $8 billion of cumulative free cash flow versus most peers being free cash flow negative at this price deck. At the same time, free cash flow in an upside price environment is projected to be a staggering $26 billion.
p. 4 · Read in context →
The business in one line: as first-mover preferred supplier, 'we're taking molecules that anyone can produce and selling them at a premium.'
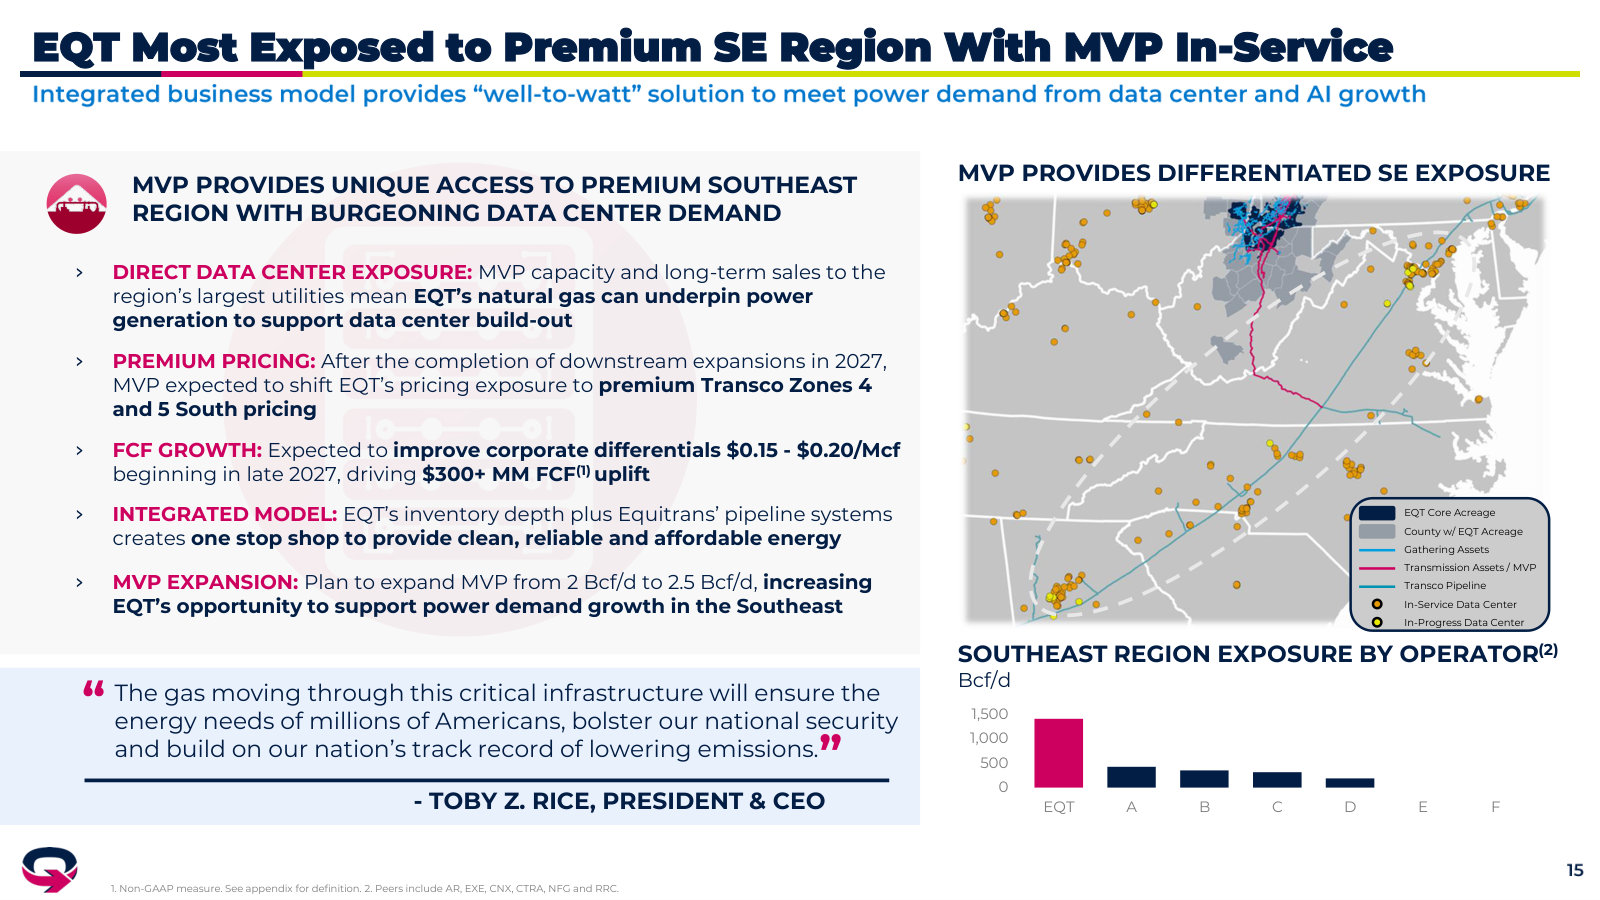
Jeremy Knop (CFO): I think it's super important to remember here, too, in terms of like in consumers reaching out wanting to buy gas, like if there is a first-mover advantage in this, like we already have it, right? We already sold 1.2 Bcf a day on a 10-year basis to the two biggest utilities in this region, right? And so when you think about where all the demand for data centers is right now in the country, today, you have about 20 gigawatts of demand. 13 of that is in the Southeast market, right? So a tremendous amount. So when these utilities reach out and they say, we need long-term reliable gas from a stable producer like EQT is the first name on the list. That is why we are the only ones who have already done a deal like this and done it at a scale that I think dwarfs what most people could do because we're the preferred supplier of gas. You have to have a lot of characteristics in your business to be able to be that preferred supplier; part of it is scale, part of it is depth of inventory, it's credit ratings. It's having a really creative team that can work with utilities and buyers of gas to structure deals like this. So look, we think we're really, really well positioned to leverage what we've already done and accelerate that. And look, like we've already done, we're taking molecules that anyone can produce and selling them at a premium. I mean that's the essence of what we're doing. And I think we can do that and unlock sustainable demand in the process.
p. 10 · Read in context →
Why integrate at all: EQT lost nearly $6B hedging in 2022 — more than the market cap it paid for Equitrans.
Jeremy Knop (CFO): One of the things that I think is remarkable to us when we step back and look at the last five years, even the winners in 2020 were the big integrated companies, right? They didn't really sweat COVID as much because they have high-quality, low-cost businesses. The winters in 2022, when you had windfall pricing for oil and gas, were again integrated because they were unhedged, right? That's why stock prices are at all-time highs. They're sitting on a lot of cash. We lost more money hedging in 2022, nearly $6 billion, than the market cap we just paid for Equitrans. So just put that in perspective and think about what happens if you go through that sort of cycle again in a world we expect to be more volatile and that looks more and more like that more frequently. If a deal like this puts us in a position where we can emulate the sort of success that those bigger companies actually achieved over that time period, the amount of shareholder value unlocked by doing that is tremendous.
p. 11 · Read in context →
More calls
Q1 2026 Earnings Call — Q1 2026 · 13 pages · Record ~$1.8B free cash flow in one quarter — roughly all of 2022's in 90 days — with leverage below 1x and the book left largely unhedged to capture the spike. · Open →
Q3 2025 Earnings Call — Q3 2025 · 17 pages · $484M FCF and $2.3B over the trailing year at just $3.25 gas; the Olympus acquisition and compression outperformance in focus. · Open →
Q2 2025 Earnings Call — Q2 2025 · 15 pages · Mid-2025 execution — marketing optimization, tactical curtailments, and continued Equitrans synergy capture as deleveraging advances. · Open →
Q4 & Full-Year 2024 Earnings Call — Q4 FY2024 / Full-Year 2024 · 13 pages · The first full year after closing Equitrans: integration ~90% complete, >$200M of annualized base synergies (85% of plan), and the 2025 budget built on faster compression benefits. · Open →
Q4 2023 Earnings Call — Q4 2023 · 17 pages · The standalone-EQT baseline, reported just before the March 2024 Equitrans announcement — cost structure and curtailment strategy pre-integration. · Open →
Q3 2023 Earnings Call — Q3 2023 · 18 pages · Earlier standalone EQT — operational efficiency gains and the low-cost 'north star' before vertical integration reshaped the story. · Open →
EQT Corporation's annual reports contain management's most considered account of the business. These are the sections, passages and visual pages worth opening in the originals preserved in Sources.
EQT Corporation — FY2025 Annual Report (Form 10-K) — FY2025
EQT's first 10-K as a fully vertically integrated gas company post-Equitrans — three-segment structure plus the Olympus deal. · Open the full document →
Item 1. Business — General and Strategy — p. 11 · Read the full section →
Management's own framing of the vertically integrated, low-cost model built to generate free cash flow across price cycles.
Vertically integrated across upstream, gathering and transmission; strategy to be the low-cost producer.
We are a vertically integrated natural gas company with upstream, gathering and transmission operations focused in the Appalachian Basin. As of December 31, 2025, we had 28.0 Tcfe of proved natural gas, NGLs and oil reserves across approximately 2.3 million gross acres and approximately 2,945 miles of pipeline infrastructure. […] Our core business strategy is to be the leading low-cost producer of natural gas with a business model designed to generate durable free cash flow across commodity price cycles. […] As the only large-scale, integrated natural gas producer in the United States, we believe we are well positioned to excel during times of market volatility and to serve growing sources of demand, including power generation, industrial consumption, domestic data center development and LNG exports.
p. 11 · Read in context →
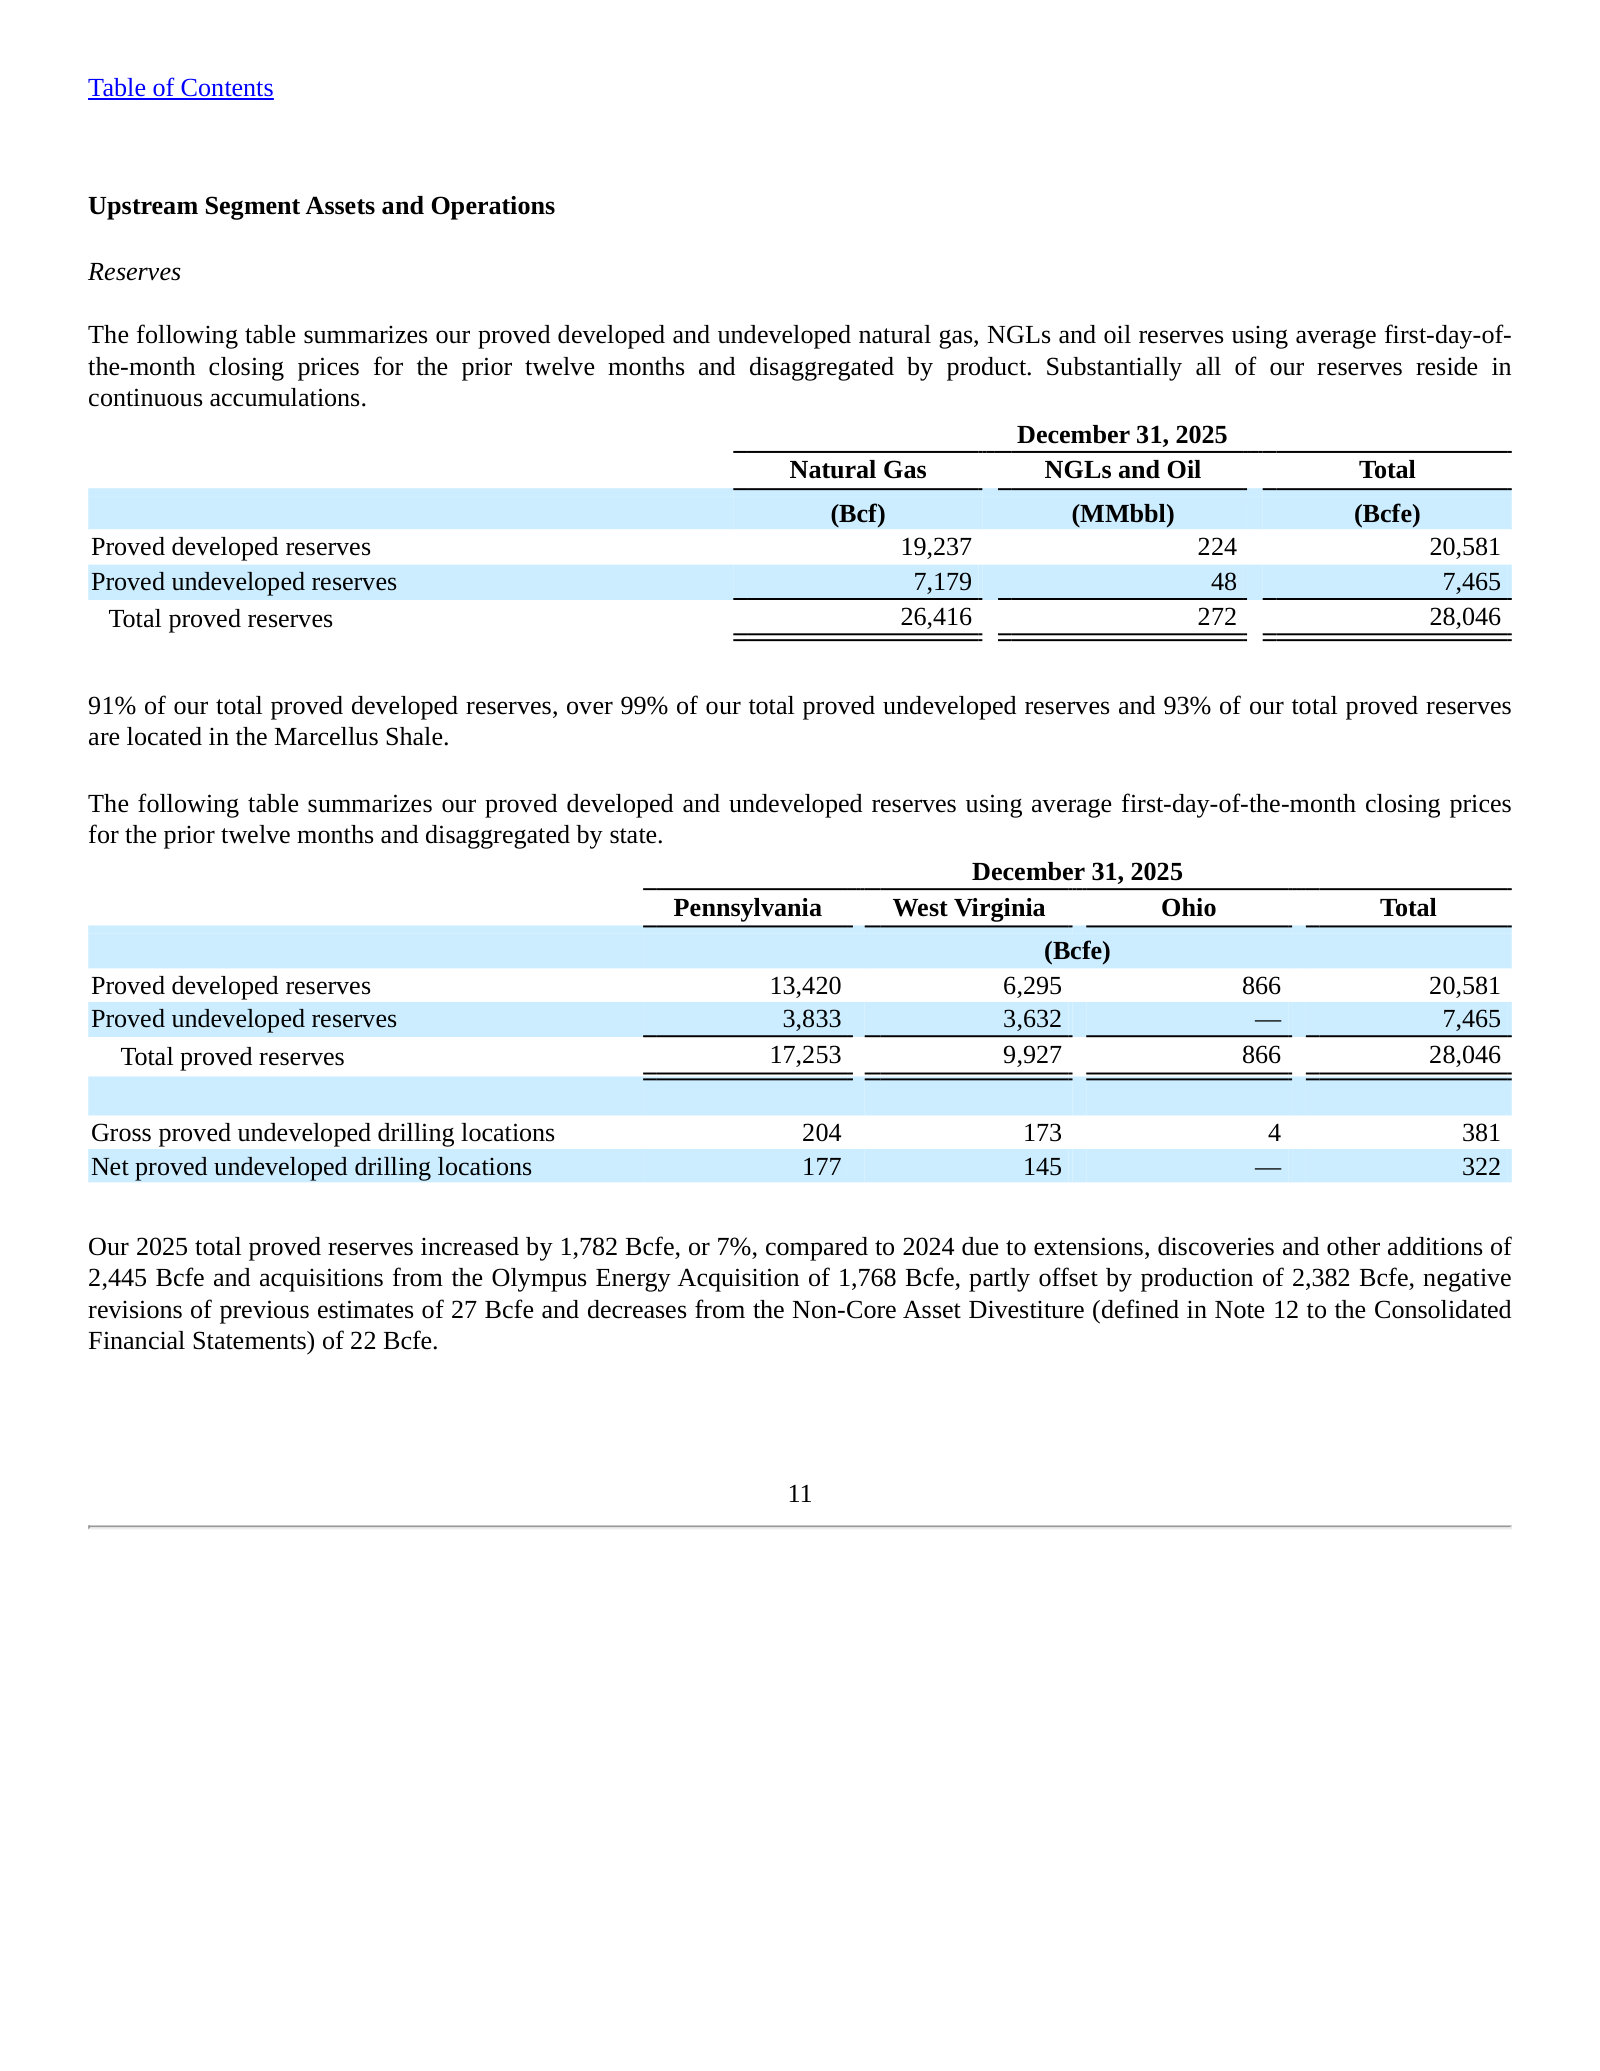
Upstream Segment — Reserves — p. 15 · Read the full section →
The asset base in one table: 28.0 Tcfe of proved reserves, 93% in the Marcellus, by product and by state.
Gathering and Transmission Segment Assets and Operations — p. 23 · Read the full section →
Shows the integration economics: most midstream throughput and revenue now comes from EQT's own upstream volumes.
Roughly three-quarters of gathering throughput and revenue is captive Upstream volume.
Our Gathering segment has gathering agreements with our Upstream segment and with third parties. […] For the year ended December 31, 2025, our Upstream segment accounted for approximately 73% of our gathering system throughput and approximately 76% of our Gathering segment's operating revenues.
p. 23 · Read in context →
Item 1A. Risk Factors — p. 47 · Read the full section →
The two risks most specific to EQT: near-total exposure to volatile gas prices and a $7.8B debt load near investment-grade's edge.
~93% of proved developed reserves are gas; Henry Hub ranged $2.65–$9.86/MMBtu in 2025.
Because our production and reserves predominantly consist of natural gas (approximately 93% of our equivalent proved developed reserves as of December 31, 2025), changes in natural gas prices have a significantly greater impact on our financial results than oil prices. […] The daily spot prices for NYMEX Henry Hub natural gas ranged from a high of $9.86 per MMBtu to a low of $2.65 per MMBtu between the period from January 1, 2025 through December 31, 2025, and the daily spot prices for NYMEX WTI oil ranged from a high of $80.73 per barrel to a low of $55.44 per barrel during the same period.
p. 57 · Read in context →
$7.8B of debt outstanding, with credit-rating downside if gas prices fall.
As of December 31, 2025, we had $7.8 billion of debt outstanding, and we may incur additional indebtedness in the future. […] In addition, our level of indebtedness may be viewed negatively by credit rating agencies and our credit ratings may be lowered.
p. 64 · Read in context →
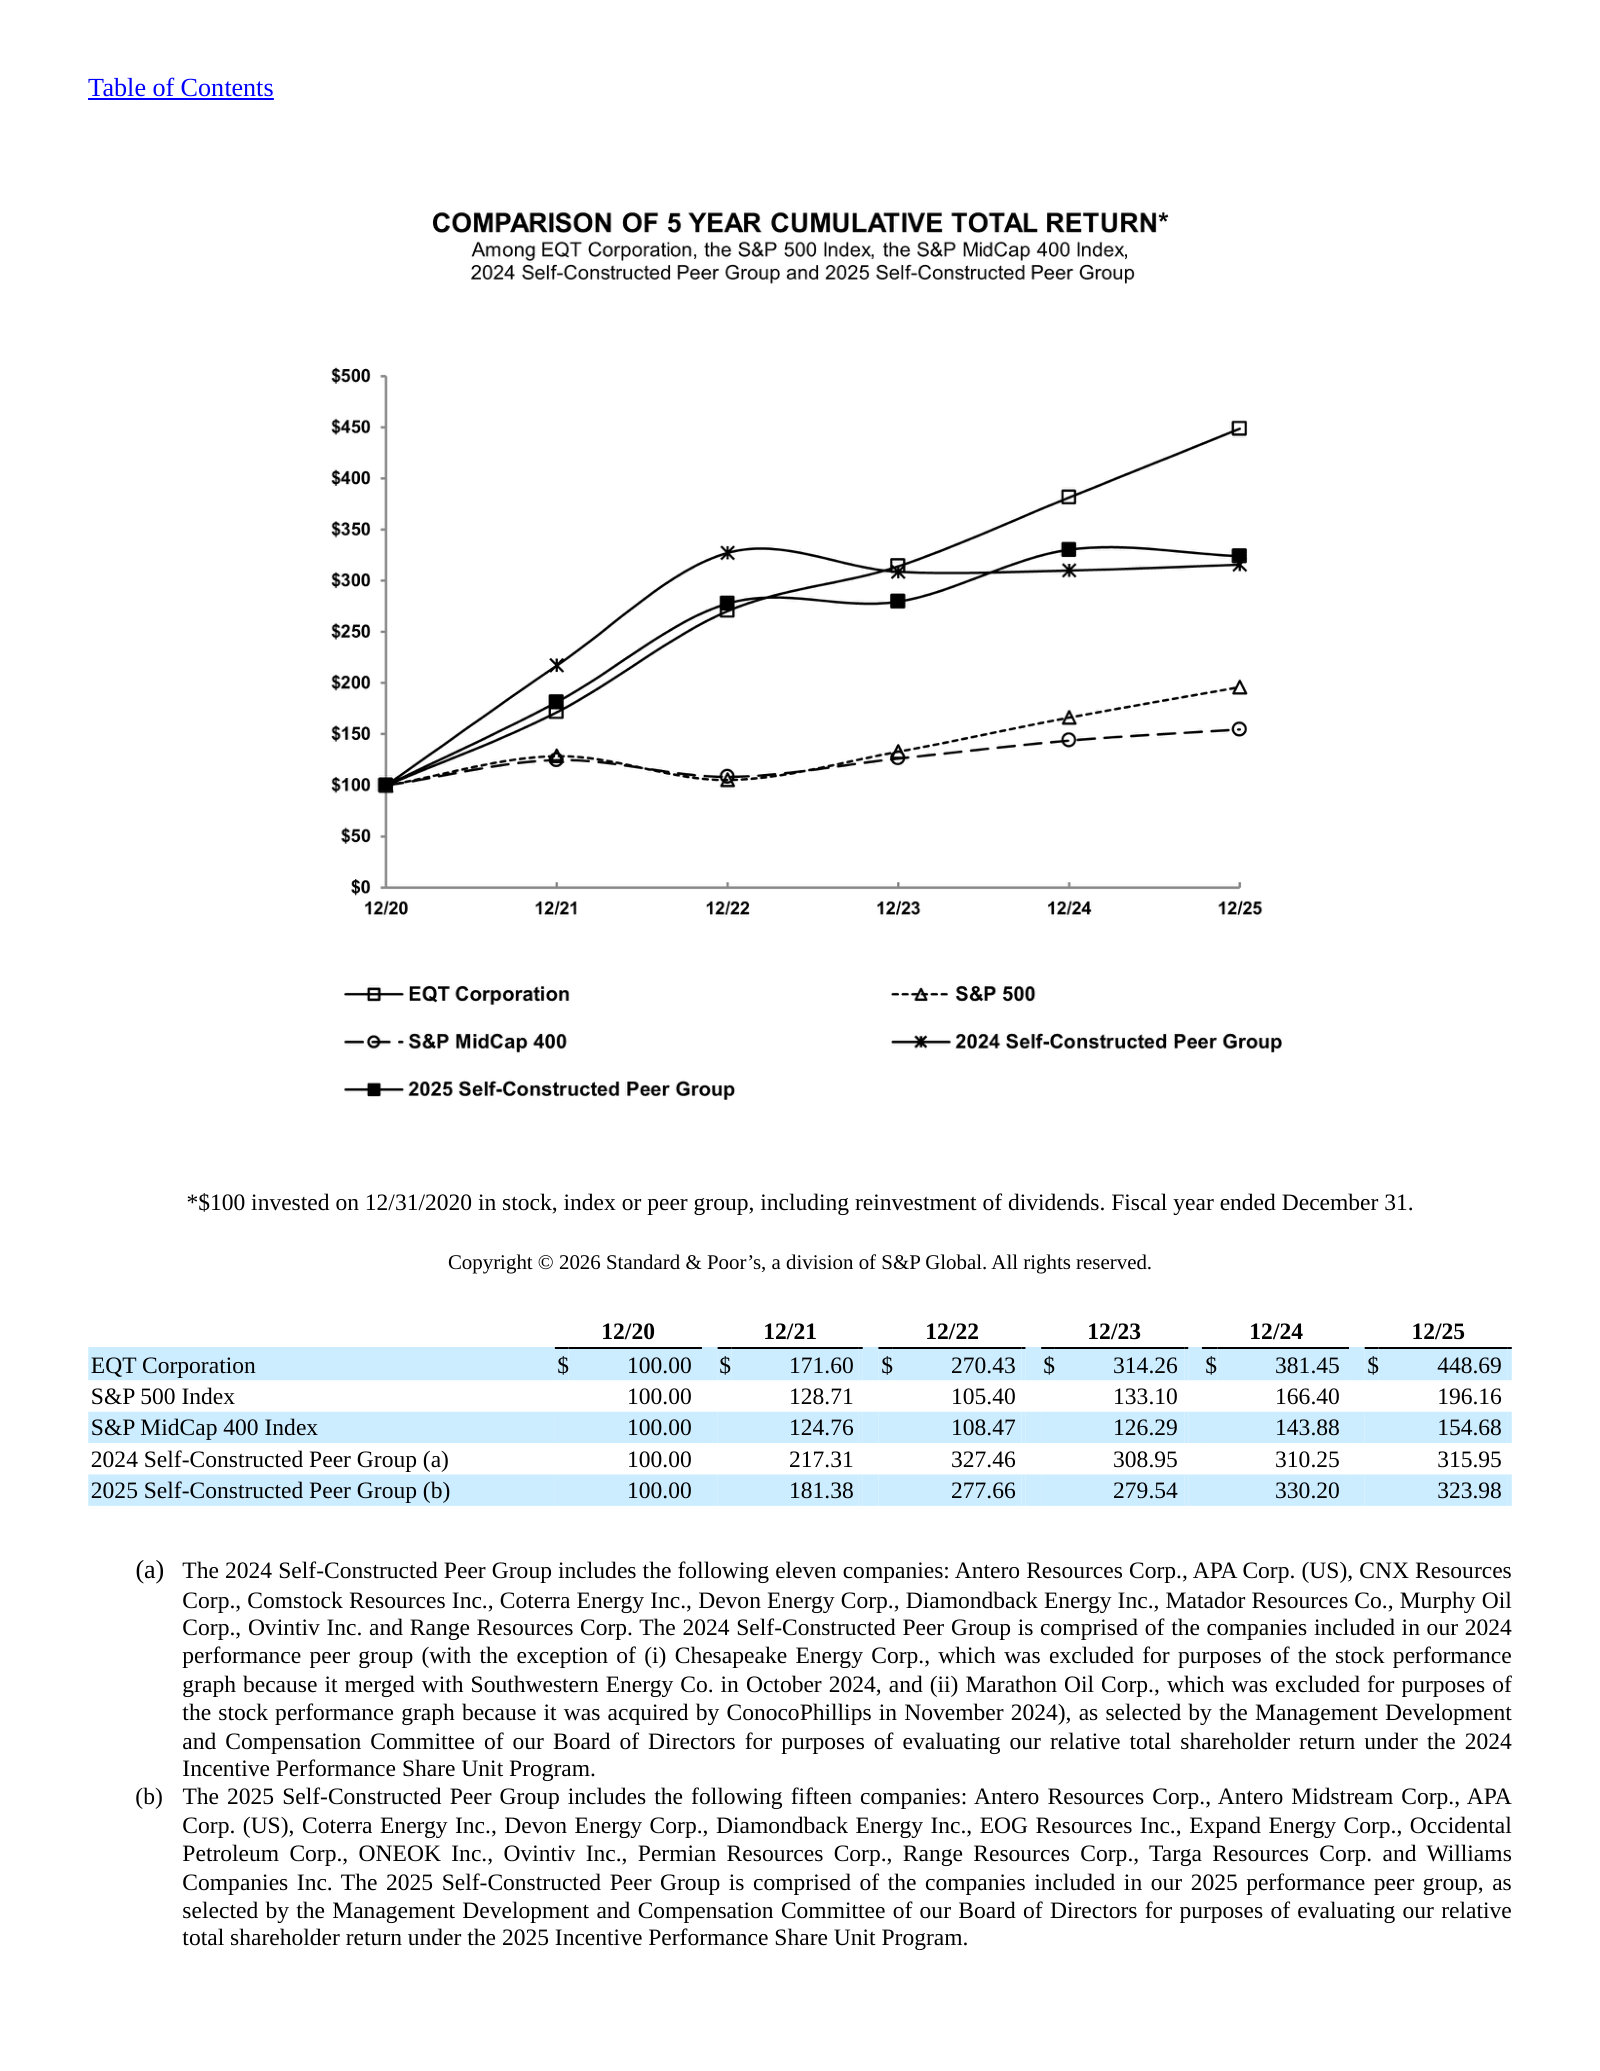
Item 5. Market for Common Equity — Five-Year Total Return — p. 90 · Read the full section →
A $100 investment at end-2020 grew to ~$449 by end-2025, outrunning the S&P 500 and MidCap 400.
Item 7. Management's Discussion and Analysis — p. 92 · Read the full section →
Where management explains the year: the reshaping transactions and the swing in earnings they produced.
The 2024–25 reshaping: $3.5B Midstream JV sale and the Equitrans merger integration.
Our results of operation for 2025 reflect the impact of the Midstream Joint Venture Transaction (defined in Note 9 to the Consolidated Financial Statements), where we received $3.5 billion of cash consideration from a third-party investor in exchange for a noncontrolling equity interest in the Midstream Joint Venture. […] Beginning July 22, 2024, our results of operations reflect our operation of the assets acquired in the Equitrans Midstream Merger (defined in Note 11 to the Consolidated Financial Statements).
p. 92 · Read in context →
Net income jumped to $2,039M ($3.31/sh) from $231M ($0.45/sh), driven by higher realized gas prices.
Net income attributable to EQT Corporation for 2025 was $2,039 million, $3.31 per diluted share, compared to $231 million, $0.45 per diluted share, for 2024. The increase was driven predominantly by higher sales of natural gas, reflecting higher average realized natural gas prices.
p. 94 · Read in context →
Critical Accounting Estimates — Oil and Gas Reserves — p. 112 · Read the full section →
Reserve estimates set depletion rates and impairment tests — the estimate that most defines a producer's reported results.
How proved reserves are defined and why quantity revisions flow straight into the financials.
Proved oil and gas reserves, as defined by SEC Regulation S-X Rule 4-10, are those quantities of oil and gas that, by analysis of geoscience and engineering data, can be estimated with reasonable certainty to be economically producible from known reservoirs under existing economic conditions, operating methods and government regulations prior to the time at which contracts providing the right to operate expire unless evidence indicates that renewal is reasonably certain regardless of whether deterministic or probabilistic methods are used for the estimation. […] Material changes in proved reserve quantities could affect our depletion rates and, therefore, the Consolidated Financial Statements.
p. 112 · Read in context →
EQT Corporation — FY2023 Annual Report (Form 10-K) — FY2023
Pre-Equitrans baseline: a pure-play 'natural gas production company' with a single Production segment — the before to FY2025. · Open the full document →
Item 1. Business — General and Strategy — p. 10 · Read the full section →
Same company two years earlier, described only as a natural gas producer — no gathering or transmission segments yet.
Before Equitrans: 'a natural gas production company,' 27.6 Tcfe, largest U.S. gas producer by volume.
We are a natural gas production company with operations focused in the Appalachian Basin. As of December 31, 2023, we had 27.6 Tcfe of proved natural gas, NGLs and oil reserves across approximately 2.1 million gross acres, and, based on average daily sales volume, we were the largest producer of natural gas in the United States.
p. 10 · Read in context →
More annual reports
EQT Corporation — FY2024 Annual Report (Form 10-K) — FY2024 · 227 pages · The transition year: first report consolidating the Equitrans midstream assets acquired in July 2024. · Open →
EQT Corporation — FY2022 Annual Report (Form 10-K) — FY2022 · 213 pages · Peak-gas-price year; useful for seeing realized prices and cash flow before the midstream build-out. · Open →
EQT Corporation — FY2021 Annual Report (Form 10-K) — FY2021 · 176 pages · Early post-Rice-era upstream consolidation baseline for the Appalachian pure-play. · Open →
Source: S&P Capital IQ consensus via Xpressfeed · Generated 2026-08-02.
EQT's consensus tape is being marked down at the near end even as the print record stays strong. Normalized-EPS estimates for FY2027 have fallen roughly 16% over the past 180 days and revenue about 6%, carving an FY2027 dip between higher FY2026 and FY2028 numbers. Yet the company has beaten normalized EPS in seven of the last eight quarters, and the sell side remains overwhelmingly positive with no sell ratings. Coverage thins sharply beyond FY2028.
Estimate momentum
EPS is being cut faster than revenue for FY2027, a near-year, margin-led downgrade. FY2028 normalized EPS has barely moved over 180 days.
Currency: USD · Scale: money in millions, absolute · Point-in-time consensus; Δ90d is Now versus 90d.
| Metric | FY | 180d | 90d | 30d | Now | Δ90d |
|---|---|---|---|---|---|---|
| EPS (normalized) | FY2027 | $4.77 | $4.67 | $4.39 | $3.98 | -14.8% |
| EPS (normalized) | FY2028 | $5.19 | $5.37 | $5.23 | $5.16 | -4.0% |
| Revenue | FY2027 | $9.84bn | $9.68bn | $9.45bn | $9.25bn | -4.4% |
| Revenue | FY2028 | $10.78bn | $10.29bn | $9.92bn | $10.13bn | -1.6% |
Beat / miss record
Current sequences by metric: Revenue: 1 consecutive miss; EPS (normalized): 1 consecutive miss.
Currency: USD · Scale: money in millions, absolute · Consensus is captured before each actual first became effective.
| Quarter | Metric | Consensus | Actual | Surprise | Outcome |
|---|---|---|---|---|---|
| Q2 FY2026 | Revenue | $1.84bn | $1.81bn | -1.7% | Miss |
| Q2 FY2026 | EPS (normalized) | $0.40 | $0.39 | -3.2% | Miss |
| Q1 FY2026 | Revenue | $3.24bn | $3.38bn | +4.2% | Beat |
| Q1 FY2026 | EPS (normalized) | $2.15 | $2.33 | +8.4% | Beat |
| Q4 FY2025 | Revenue | $2.16bn | $2.39bn | +10.4% | Beat |
| Q4 FY2025 | EPS (normalized) | $0.76 | $0.90 | +17.7% | Beat |
| Q3 FY2025 | Revenue | $1.81bn | $1.96bn | +8.4% | Beat |
| Q3 FY2025 | EPS (normalized) | $0.38 | $0.52 | +38.2% | Beat |
| Q2 FY2025 | Revenue | $1.74bn | $2.56bn | +46.7% | Beat |
| Q2 FY2025 | EPS (normalized) | $0.41 | $0.45 | +10.0% | Beat |
| Q1 FY2025 | Revenue | $2.09bn | $1.74bn | -16.8% | Miss |
| Q1 FY2025 | EPS (normalized) | $1.01 | $1.18 | +16.6% | Beat |
| Q4 FY2024 | Revenue | $1.81bn | $1.62bn | -10.5% | Miss |
| Q4 FY2024 | EPS (normalized) | $0.53 | $0.69 | +31.4% | Beat |
| Q3 FY2024 | Revenue | $1.39bn | $1.28bn | -7.9% | Miss |
| Q3 FY2024 | EPS (normalized) | $0.07 | $0.12 | +77.2% | Beat |
Consensus revenue and EBITDA both sag in FY2027 before FY2028 reacceleration
Both revenue and EBITDA step down in FY2027 versus FY2026 before reaccelerating in FY2028, mirroring the near-year estimate cuts.
Currency: USD · Scale: money in millions, absolute · YoY uses the prior fiscal year from the feed; analyst count and range use the first displayed period.
| Metric | FY2025A | FY2026E | FY2027E | FY2028E | YoY | Analysts | Low / high |
|---|---|---|---|---|---|---|---|
| Revenue | $8.43bn | $9.44bn | $9.25bn | $10.13bn | — | 10 | $8.26bn / $8.68bn |
| EBITDA | $5.45bn | $6.48bn | $6.44bn | $7.27bn | — | 21 | $5.01bn / $5.92bn |
| EPS (normalized) | $2.91 | $4.15 | $3.98 | $5.16 | — | 24 | $2.59 / $3.28 |
| Net income (GAAP) | $1.87bn | $2.70bn | $2.76bn | $3.15bn | — | 12 | $1.78bn / $1.99bn |
Analysts split hard on FY2027: normalized EPS spans 1.66 to 5.80
The FY2027 normalized-EPS range is unusually wide for a well-covered near year, and FY2027 EBITDA is nearly as dispersed across 19 analysts.
Currency: USD · Scale: money in millions, absolute · Spread/mean is absolute high-low divided by absolute mean.
| Metric | Period | Mean | Low–high | Spread/mean | Analysts |
|---|---|---|---|---|---|
| EPS (normalized) | FY2027E | $3.98 | $1.66–$5.80 | 103.9% | 23 |
| EBITDA | FY2027E | $6.44bn | $4.60bn–$7.97bn | 52.2% | 19 |
| EPS (normalized) | FY2028E | $5.16 | $3.39–$7.47 | 79.1% | 16 |
Street snapshot
Currency: USD · Scale: money in millions, absolute · Analyst counts shown explicitly.
| Street view | Reading | Analysts |
|---|---|---|
| Recommendation mix | Buy 17, Outperform 3, Hold 5, Underperform 0, Sell 0 | 25 |
| Consensus score | 1.52 | 25 |
| Target price | mean $67.08; median $67.00; high $81.00; low $52.00 | 25 |
Coverage thins sharply beyond FY2028
FY2029 rests on just two to three analysts per line (revenue and normalized EPS at n=2), and even FY2028 revenue draws only nine estimates. Treat the outer years as thin.
Visible Alpha broker models via S&P Xpressfeed · 20 brokers · 429 line items · freshest revision 2026-07-27.
The street models EQT, the largest US natural gas producer, as converting a modest price-and-volume recovery into rapid balance-sheet repair: forward models carry net debt down sharply each year while free cash flow compounds. Realized gas prices sit below Henry Hub on Appalachian basis, so the top line is driven as much by volume growth as by the benchmark. Near-term P&L coverage is deep at up to 20 brokers, but the forward drivers — prices, midstream, per-unit costs — rest on fewer models. The Equitrans-derived midstream segment is now in the model but remains a small slice of a still-commodity-gas story.
Deleveraging is the model's centerpiece — net debt falls every year as free cash flow compounds
Free cash flow is modeled up ~34% in FY-2026 and net debt drops roughly a third that year, with brokers carrying the decline through FY-2028. Capital expenditures rise ~15% in FY-2026, so the deleveraging is funded by cash generation, not spending restraint.
| Line | FY-2025A | FY-2026E | FY-2027E | FY-2028E | YoY | Brokers |
|---|---|---|---|---|---|---|
| Cash flow | — | — | — | — | — | — |
| EBITDA | $5.61bn | $6.44bn | $6.17bn | $7.21bn | +14.6% | 12 |
| Capital expenditures | $2.37bn | $2.73bn | $2.82bn | $2.81bn | +15.0% | 16 |
| Free cash flow | $2.61bn | $3.52bn | $3.25bn | $3.95bn | +34.6% | 13 |
| Balance sheet | — | — | — | — | — | — |
| Net debt | $7.66bn | $4.98bn | $3.23bn | $986.62m | -35.0% | 13 |
The growth engine: gas-price recovery plus steady volume lift oil, NGL and gas revenue
Realized gas prices run below Henry Hub — about $3.09 versus $3.43 in FY-2025 — reflecting Appalachian basis. Total oil, NGL and gas revenue is modeled up ~14% in FY-2026 on a mix of higher prices and low-single-digit volume growth.
| Line | FY-2025A | FY-2026E | FY-2027E | FY-2028E | YoY | Brokers |
|---|---|---|---|---|---|---|
| Price | — | — | — | — | — | — |
| Henry Hub - Natural gas price($) | $3.45 | $3.65 | $3.46 | $3.74 | +5.8% | 17 |
| Natural gas price before hedging($) | $2.91 | $3.11 | $3.03 | $3.68 | +6.8% | 18 |
| Volume | — | — | — | — | — | — |
| Gas equivalent production(Bcfe) | 2.37bn mcfe | 2.46bn mcfe | 2.47bn mcfe | 2.55bn mcfe | +3.8% | 20 |
| Revenue | — | — | — | — | — | — |
| Revenue - Natural Gas | $6.94bn | $7.94bn | $7.82bn | $8.86bn | +14.5% | 18 |
| Revenue - Oil, NGL and Natural Gas | $7.62bn | $8.73bn | $8.47bn | $9.53bn | +14.5% | 18 |
Brokers agree near-term but split on the FY-2027/28 gas-price payoff
The spread maps to the out-year gas-price assumption: bearish models keep EQT levered into FY-2028 while the bullish ones carry it to net cash.
| Line | Period | Median | Q1–Q3 | Min–max | Brokers |
|---|---|---|---|---|---|
| Revenue - Natural Gas | FY-2027E | $7.91bn | $7.66bn–$8.26bn | $5.89bn–$9.02bn | 12 |
| Free cash flow | FY-2027E | $3.41bn | $2.56bn–$3.58bn | $2.02bn–$4.79bn | 11 |
| Net debt | FY-2028E | $621.70m | $237,257–$1.48bn | $-1.49bn–$6.15bn | 10 |
Midstream (Equitrans) is real but small — the model is still a commodity-gas bet
The Equitrans-derived pipeline and midstream revenue line is modeled as real and stable but small — a minor fraction of oil, NGL and gas revenue across the forecast. The forward model remains overwhelmingly a bet on gas price times volume, not on midstream fees.
Coverage is deep on the P&L but thins on the forward drivers
Headline P&L lines carry up to 20 brokers, but forward drivers are thinner — realized price after hedging and midstream rest on roughly a dozen, and several per-unit and reserve lines on just 2-3. FY-2028 figures generally reflect about 10 models. Revisions are recent (late July 2026), so the concern is depth, not staleness.
Headline P&L consensus, momentum and beat/miss live in the CapIQ tab.
Source: S&P Capital IQ transcripts via Xpressfeed · latest indexed call 2026-07-22 · generated 2026-08-02.
Latest call digest
EQT Corporation, Q2 2026 Earnings Call, Jul 22, 2026 · 2026-07-22T14:00:00
Q2 2026 call — July 22, 2026. Prepared remarks were a victory lap: record operations (the longest lateral in shale history at more than 29,000 feet), Q2 volumes well above the high end of guidance, and $330 million of free cash flow despite gas averaging just $2.89/MMBtu. On the strength of base-production outperformance from Equitrans compression projects, management raised full-year 2026 production guidance by ~90 Bcfe and trimmed CapEx by $25 million. New strategic items: FERC construction approval on MVP Southgate (accelerated into 2026, pulling forward ~$85 million of capex); a 10-year, 325 MMcf/d supply deal to CPV's Shay power project priced off PJM power rather than gas; the ~$77 million Blackline Midstream propane acquisition; and a 5-year ~0.5 mtpa LNG offtake to an Asian buyer starting 2028 (+~$45 million to 2028 FCF). EQT is 'on the doorstep' of its $5 billion net-debt target and is pivoting to accumulate cash for aggressive, countercyclical buybacks.
The Q&A was less about the beat and more about whether the story is real and when it pays off. Analysts pressed hardest on the 'Slide 22' Appalachia demand wave — how ~20 Bcf/d of potential demand actually gets supplied, how to risk it, and when the market prices it — and on the spark-spread risk in the new power-linked contracts. Notably, on hedging management introduced its first clear near-term caution, calling potential gas-price weakness a 'short-term soft spot' tied to Permian growth and weather, while staying firmly bullish on 2028 and beyond. Guidance actually stated on the call: 2026 production +90 Bcfe / CapEx -$25 million; the CPV deal framed at ~$100 million/year of FCF at full-year, full-capacity utilization; and +$45 million to 2028 FCF from the new LNG offtake.
Participant coverage from the latest call.
| Group | Participants | Count |
|---|---|---|
| Management | Operator; Cameron Horwitz — Managing Director of Investor Relations & Strategy, EQT Corporation; Toby Rice — President, CEO & Director, EQT Corporation; Jeremy Knop — Chief Financial Officer, EQT Corporation | 4 |
| Analysts | Joshua Silverstein — Analyst, UBS Investment Bank, Research Division; Douglas George Blyth Leggate — MD & Senior Research Analyst, Wolfe Research, LLC; Wei Jiang — Research Analyst, Barclays Bank PLC, Research Division; Arun Jayaram — Senior Equity Research Analyst, JPMorgan Chase & Co, Research Division; Neil Mehta — VP and Integrated Oil & Refining Analyst, Goldman Sachs Group, Inc., Research Division; Phillip Jungwirth — U.S. Energy Analyst, BMO Capital Markets Equity Research; Neal Dingmann — Research Analyst, William Blair & Company L.L.C., Research Division; Sam Margolin — Equity Analyst, Wells Fargo Securities, LLC, Research Division; Gabe Daoud — Research Analyst, Truist Securities, Inc., Research Division; James West — MD and Head of Energy & Power Research, Melius Research LLC; Bob Brackett — MD & Senior Research Analyst, Bernstein Institutional Services LLC, Research Division; Jacob Roberts — Director of Exploration and Production Research, TPH Research; Kevin MacCurdy — Director of Research, Pickering Energy Partners Insights | 13 |
Curated latest-call exchanges; one row per analyst topic.
| Analyst | Firm | Topic | What changed in Q&A |
|---|---|---|---|
| Douglas Leggate | Wolfe Research | Growth discipline — why grow at all | Pressed why EQT would grow volumes rather than reallocate existing gas into premium in-basin deals. Management said ~30% of volumes sit on medium/longer-term contracts and can be reallocated, but the priority is direct demand connections first; any organic growth would be a fraction of demand, not the full amount. |
| Wei (Betty) Jiang | Barclays | CPV power-linked contract downside | Asked whether the electricity-indexed deal carries a floor or downside protection. Jeremy Knop said there is no floor but framed long power exposure as favorable given how tightly PJM power and gas correlate, illustrating ~$100 million/year of FCF at full utilization. |
| Joshua Silverstein | UBS | Cash build vs. buybacks | Asked the right level of cash to hold for stock weakness. Management said it is willing to accumulate up to a few billion dollars but, with the stock near a 52-week low, leans toward being more aggressive on buybacks — countercyclical rather than pro-cyclical. |
| Neil Mehta | Goldman Sachs | Hedging and near-term gas risk | Management flagged Permian-growth and weather risks as a possible short-term soft spot and said hedging is aimed at next summer so it can lean aggressively into buybacks through any down cycle, while viewing 2028+ as structurally strong. |
| Phillip Jungwirth | BMO Capital Markets | Risking the demand wave | Pushed on the biggest obstacles to the demand materializing and how EQT picks partners. Management said it assigned probabilities across the projects and arrived at high-single-digit Bcf/d — roughly 40% of the total potential — as realistic. |
| Jacob Roberts | TPH | Compression spend cadence and maintenance capital | A multi-part question management initially asked to be rephrased. After rephrasing, Toby Rice said compression will be deployed on wellbores representing about 0.5 Bcf/d each year, with ~30 projects identified beyond this year's six, mapped out through 2029. |
Theme tracker
Themes are curator-classified across supplied calls.
| Theme | Status | Quarters mentioned | Read-through |
|---|---|---|---|
| In-basin power and data-center demand in Appalachia | persisted | Q3 2023, Q4 2023, Q1 2024, Q2 2024, Q3 2024, Q4 2024, Q1 2025, Q2 2025, Q3 2025, Q4 2025, Q1 2026, Q2 2026 | The through-line of the whole history, but its character escalated: early calls framed it as coal-displacement and utility firm-sales off MVP; by 2024-2025 it became a data-center/power-generation story; by 2026 it is the central 'demand wave' (Slide 22, ~20 Bcf/d of potential projects), with signed deals like CPV Shay and Homer City. The debate has shifted from 'is it real' to 'when does it price in.' |
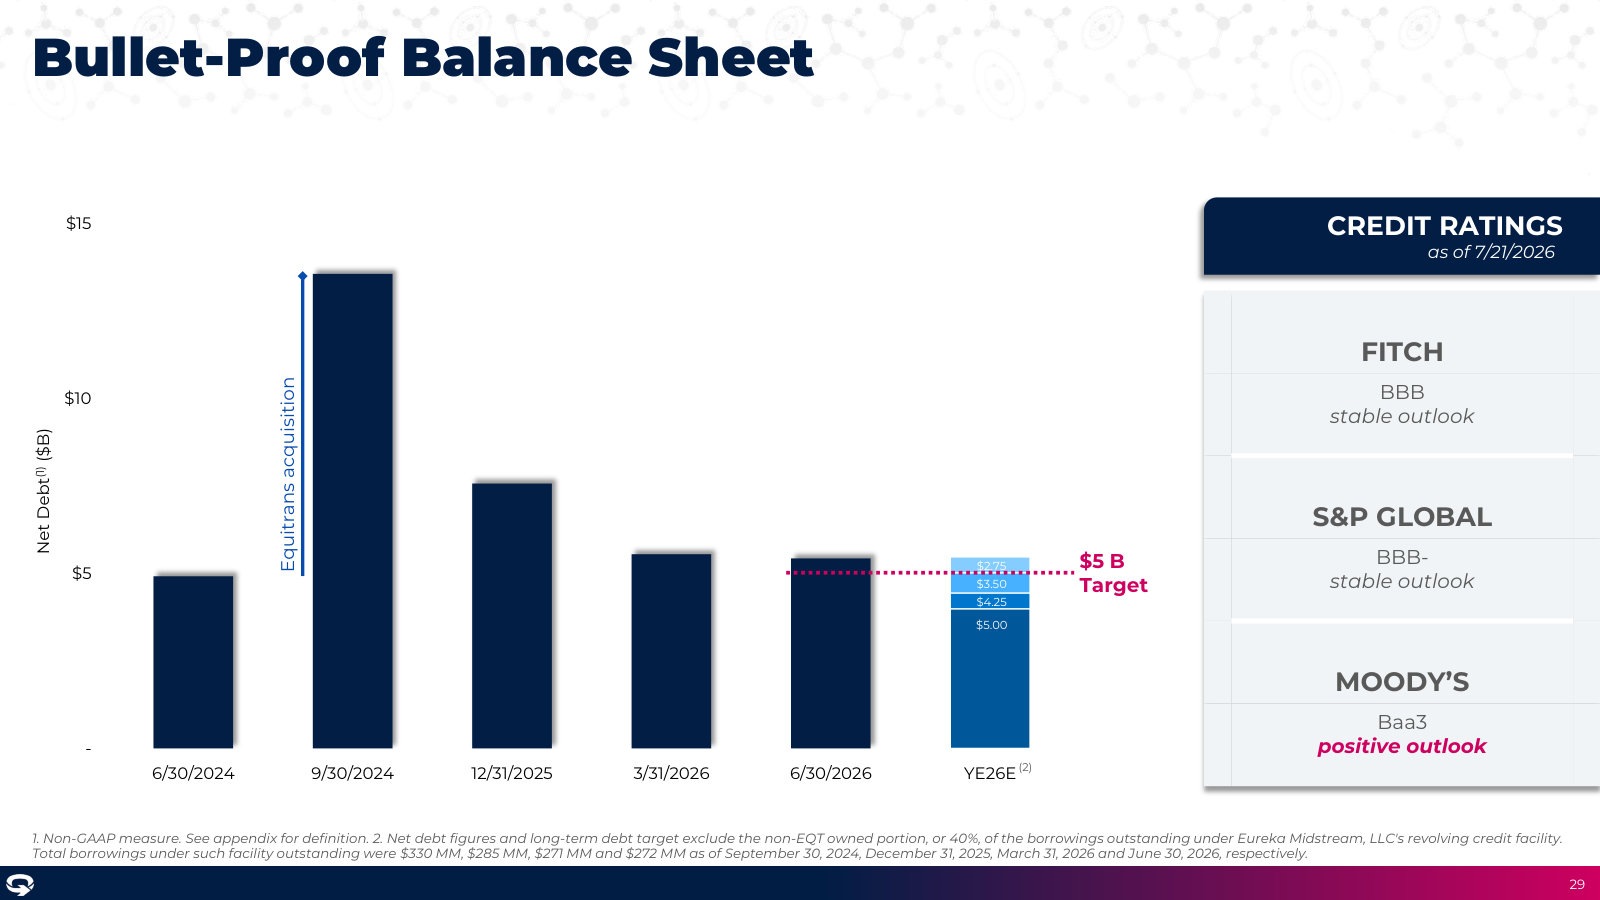
| Deleveraging toward the $5 billion net-debt target | persisted | Q3 2023, Q4 2023, Q1 2024, Q2 2024, Q3 2024, Q4 2024, Q1 2025, Q2 2025, Q3 2025, Q4 2025, Q1 2026, Q2 2026 | The $5 billion long-term target is repeated on essentially every call. Net debt fell from ~$13.7 billion (end of Q3 2024) to just under $5.7 billion by Q1 2026, and Q2 2026 describes the company as 'on the doorstep' of the target. As the goal nears, the narrative pivots from debt paydown to buybacks. |
| Equitrans synergies and midstream compression | persisted | Q3 2023, Q4 2023, Q1 2024, Q2 2024, Q3 2024, Q4 2024, Q1 2025, Q2 2025, Q3 2025, Q4 2025, Q1 2026, Q2 2026 | From the 2023 acquisition announcement onward, compression/synergy capture is a recurring beat-and-raise driver. By 2026 management repeatedly says compression is exceeding even its upside case, extending flat times, shallowing base declines, and driving production guidance raises. |
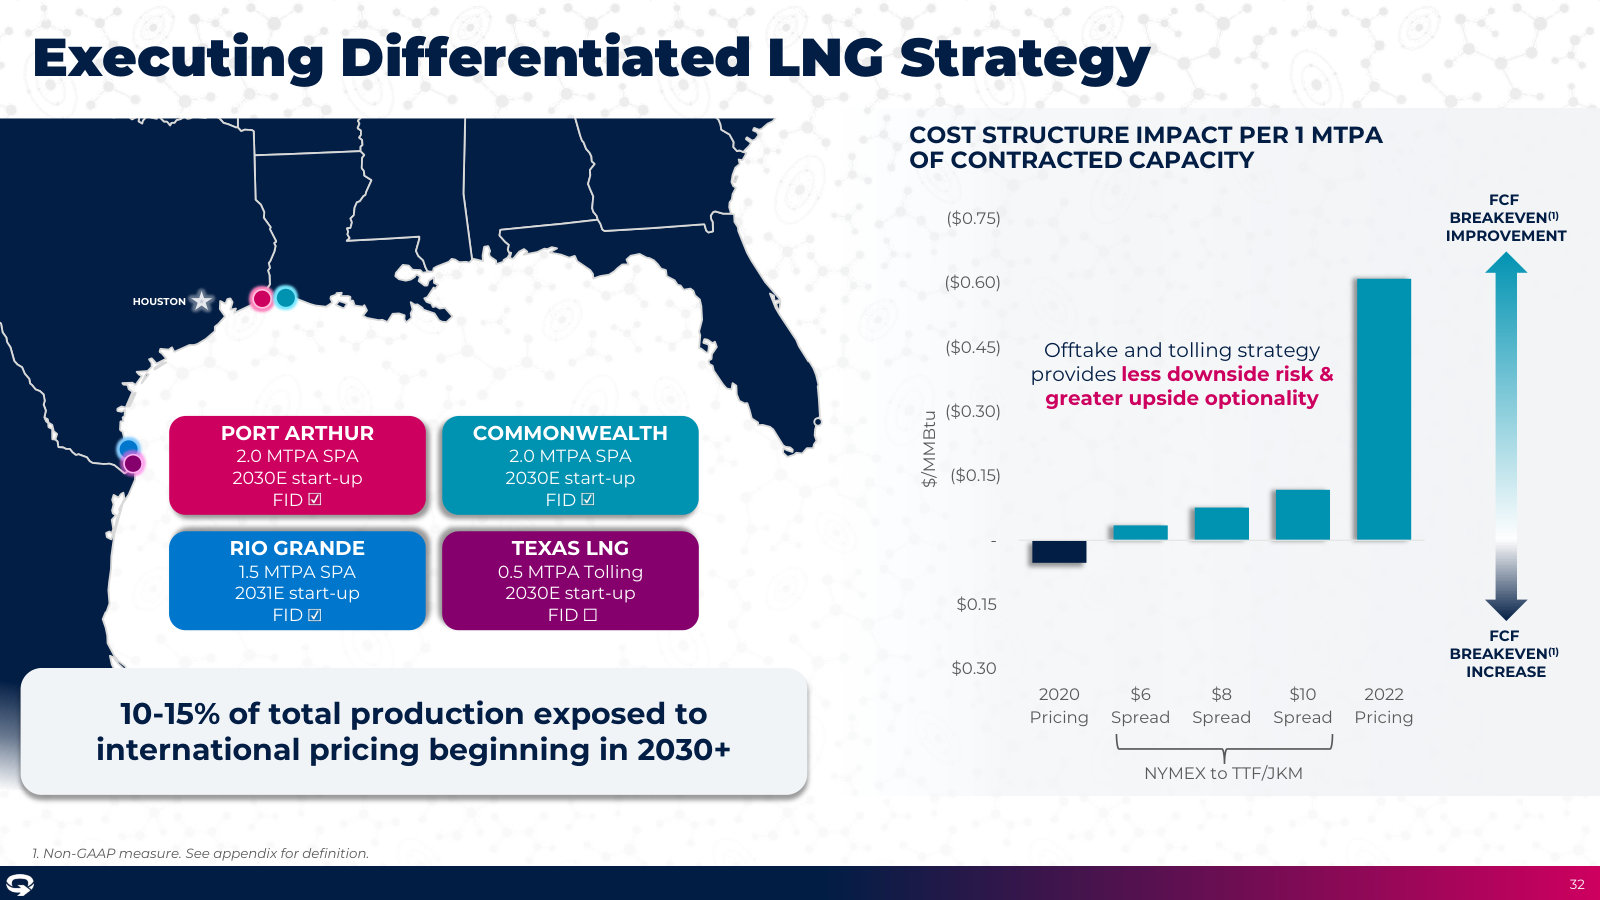
| LNG portfolio and international price exposure | persisted | Q3 2023, Q4 2023, Q1 2024, Q2 2024, Q3 2024, Q4 2024, Q1 2025, Q2 2025, Q3 2025, Q4 2025, Q1 2026, Q2 2026 | Began as small HOAs (~5% of production) and matured into signed SPAs with Sempra, NextDecade and Commonwealth for a ~2030 start. Q2 2026 added the first near-term step — a 5-year ~0.5 mtpa offtake beginning 2028 — accelerating exposure ahead of the larger 2030 portfolio. |
| Share buybacks as a capital-allocation pillar | emerged | Q4 2024, Q1 2025, Q2 2025, Q3 2025, Q4 2025, Q1 2026, Q2 2026 | Largely absent from the 2023 and mid-2024 prepared remarks, buybacks grew from an 'opportunistic, countercyclical' aspiration into a central plank once the balance sheet was derisked. By Q1-Q2 2026 management frames accumulating cash for aggressive buybacks — even calling it its M&A strategy — as the next leg of value creation. |
| Asset sales and divestitures | dropped | Q2 2024, Q3 2024, Q4 2024 | A prominent 2024 theme — marketing non-operated Northeast PA assets and a midstream JV to derisk the balance sheet, totaling $4.7 billion of proceeds closed in Q4 2024, a year ahead of schedule. With deleveraging then self-funding from free cash flow, the topic disappears from later prepared remarks; the absence reflects completion rather than a change of heart. |
| Tactical curtailments and gas marketing optimization | persisted | Q3 2023, Q4 2023, Q1 2024, Q2 2024, Q3 2024, Q4 2024, Q1 2025, Q2 2025, Q3 2025, Q4 2025, Q1 2026 | Curtailing volumes in weak-price periods and surging them back — 'synthetic storage' — plus marketing/trading gains recurs across the history (e.g., 10-15 Bcf embedded in the Q2 2026 guide, stated on the Q1 2026 call). Q1 2026 also showcased the integrated model during Winter Storm Fern. |
Guidance ledger
Quotes, calls, and speakers are source-verified; outcomes are curator-classified.
| Verbatim guidance | Call | Speaker | Curator outcome | Outcome note |
|---|---|---|---|---|
| “At strip pricing, we expect to exit 2025 with net debt of approximately $7 billion, comfortably below our target of $7.5 billion.” | EQT Corporation, Q4 2024 Earnings Call, Feb 19, 2025 · 2025-02-19T15:00:00 | Jeremy Knop | missed | EQT exited 2025 with net debt of just under $7.7 billion (stated on the Q4 2025 call), above both the ~$7 billion expectation and the $7.5 billion target, largely reflecting the mid-2025 Olympus acquisition. |
| “we expect to exit the first quarter with less than $6 billion of net debt” | EQT Corporation, Q4 2025 Earnings Call, Feb 18, 2026 · 2026-02-18T15:00:00 | Jeremy Knop | kept | The Q1 2026 call reported exiting the quarter with net debt of just under $5.7 billion, below the $6 billion mark. |
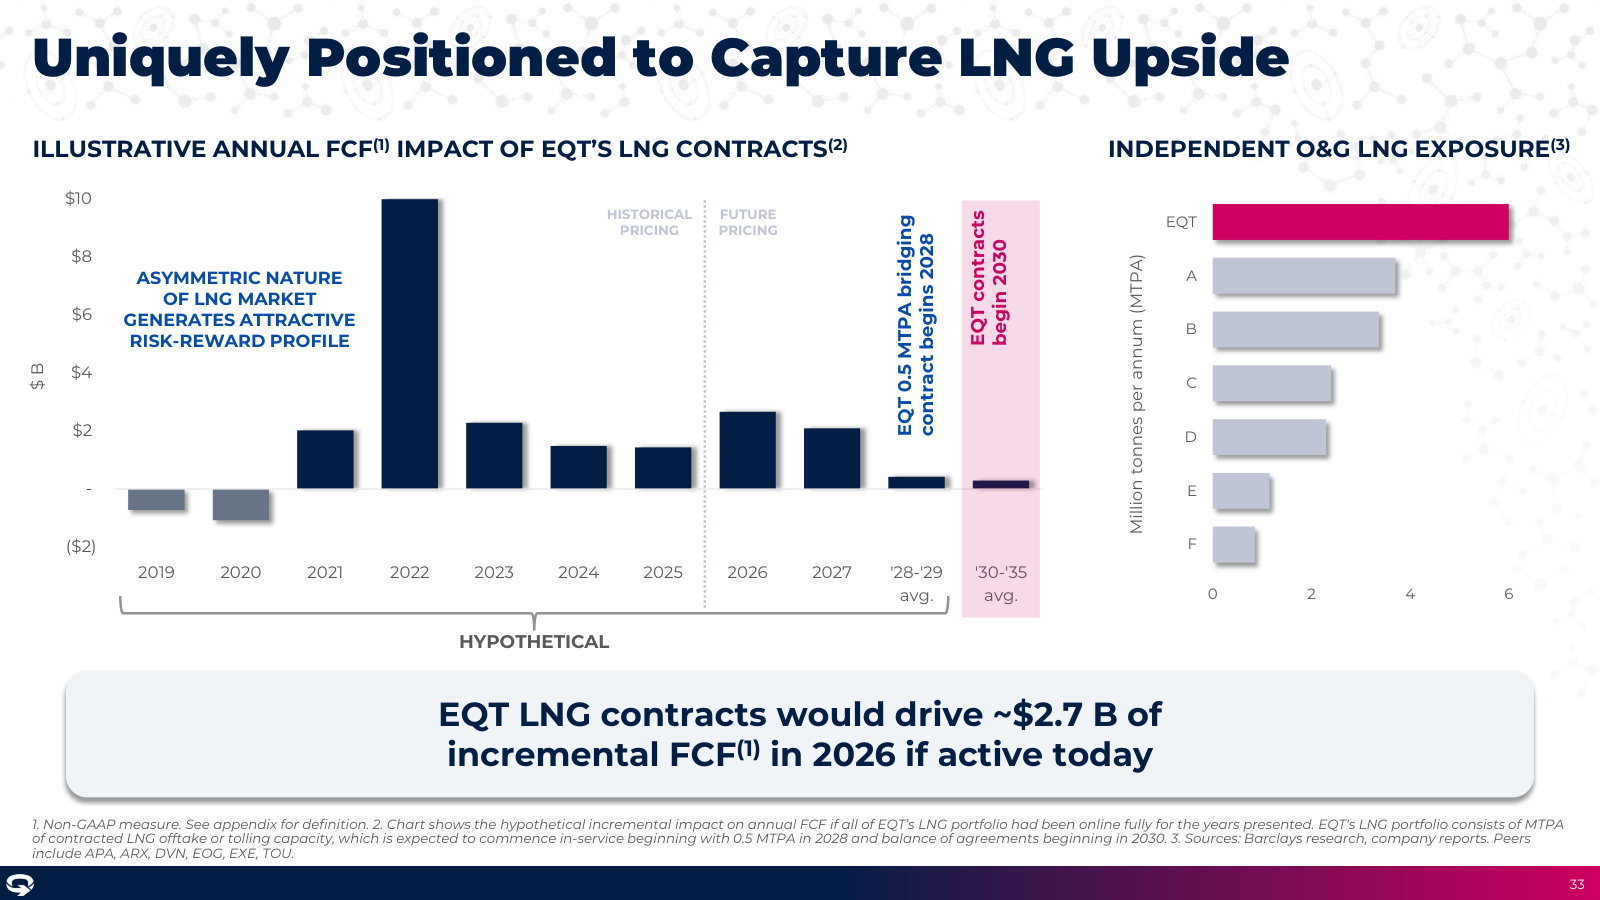
| “our LNG contracts are forecasted to generate $500 million in annual free cash flow uplift when they begin in 2030 at the current strip” | EQT Corporation, Q1 2026 Earnings Call, Apr 22, 2026 · 2026-04-22T14:00:00 | Jeremy Knop | pending | The LNG portfolio is slated to begin in 2030 and is not yet online; management notes a repeat of 2026-level volatility could push the figure to $2.5 billion. |
| “we are raising 2026 production guidance by approximately 90 Bcfe while also lowering full year CapEx by $25 million.” | EQT Corporation, Q2 2026 Earnings Call, Jul 22, 2026 · 2026-07-22T14:00:00 | Jeremy Knop | pending | Full-year 2026 is not yet complete; the raise reflects base-production outperformance from compression projects and follows the initial 2026 guide set in February 2026. |
| “we expect the contract will increase EQT's 2028 free cash flow by roughly $45 million.” | EQT Corporation, Q2 2026 Earnings Call, Jul 22, 2026 · 2026-07-22T14:00:00 | Jeremy Knop | pending | Tied to the new 5-year LNG offtake that begins in 2028; not yet realized. |
Q&A pressure map
Question counts and firms are curator tallies; analyst coverage shown above.
| Topic | Questions | Firms | Pressure / response |
|---|---|---|---|
| Appalachia demand wave (Slide 22) — how it gets supplied, risked, and when it prices in | 6 | Barclays, BMO Capital Markets, Wells Fargo, Truist, Pickering Energy Partners | The most-pressed area of the Q2 2026 call. Analysts probed how ~20 Bcf/d of potential demand actually gets supplied, how to risk it (management pegged ~40%, or high-single-digit Bcf/d, as realistic), and when the market reacts. Management leaned on the slide and its 'behind the scenes' visibility rather than firm timing. |
| Power-supply contract structure and spark-spread risk | 3 | Barclays, William Blair, TPH | Analysts pressed whether the PJM-power-linked deals (CPV Shay) carry a floor and whether EQT wants a mix of fixed-premium contracts. Management said it prefers to keep the exposure open, citing the tight gas-power correlation in PJM, and would hedge only if it chose to. |
| Capital allocation — cash build vs. buybacks and M&A appetite | 3 | UBS, William Blair, Melius Research | Repeated questions on the right cash level and whether a low reinvestment rate invites acquisitions. Management reframed buybacks as its M&A ('buying back the best company available') and stressed a countercyclical posture. |
| Compression-driven capital efficiency — how low can sustaining capital go | 3 | Wolfe Research, JPMorgan, TPH | Analysts pushed on whether compression outperformance keeps lowering maintenance capital. Management said it is still recalibrating type curves and expects continued efficiency but declined to put a specific number on the sustaining-capital reduction. |
Language shifts
Only language evidence verified against the referenced component is shown.
| Observation | Verbatim evidence | Call ID | Component |
|---|---|---|---|
| Value-creation language amplified from 'incremental' to 'exponential/compounding,' signaling rising confidence in the platform. | “Our strong results are not just incremental. They compound over time to create exponential value.” | 1979973215 | 3 |
| By Q1 2026 management declared the multi-year overhaul finished, pivoting the narrative from transformation to growth and returns. | “the transformation of EQT is now complete” | 1993085087 | 3 |
| Capital-allocation language shifts decisively from debt paydown toward accumulating cash for buybacks. | “we plan to aggressively deploy into share buybacks during the industry's episodic down cycles” | 2008718815 | 3 |
| Amid an otherwise bullish tone, Q2 2026 introduced the first explicit near-term caution on gas prices, framing weakness as temporary. | “this feels to us like potentially a very short-term soft spot.” | 2008718815 | 29 |
The call history shows a company that delivered on its deleveraging promise and is now pivoting toward buybacks and demand-linked growth. The central unresolved debate is timing — whether the large but back-end-loaded Appalachia demand wave and the 2030 LNG portfolio convert into realized pricing before the market gives credit, even as management itself now flags a near-term gas 'soft spot.'
Competitors describe EQT Corporation's market in their own filings and calls. These verified passages and visual pages show where their strategies meet, using source documents preserved in Sources.
Expand Energy (EXE) (EXE)
EQT's most direct rival — the other US producer that calls itself "the largest independent natural gas producer in the U.S." Post-Southwestern merger, Expand spans both EQT's core Appalachia (Marcellus/Utica) and the Haynesville, and competes head-on on scale, the demand thesis and low cost of supply. Featured on its "largest producer" claim, its demand read and its Haynesville cost economics; oil and NGL lines are out of scope.
Expand Energy's 10-K self-description as the largest US independent gas producer, with a footprint spanning both Appalachia (Marcellus/Utica) and the Haynesville — the same "largest producer" claim and core basins EQT stakes.
Form 10-K, Item 1 — Business: Expand Energy is the largest independent natural gas producer in the U.S., based on net daily production, and is focused on responsibly developing an abundant supply of natural gas, oil and NGL to expand energy access for all. Our operations are located in Louisiana and Texas in the Haynesville and Bossier Shales (“Haynesville”), in Pennsylvania in the Marcellus Shale (“Northeast Appalachia”) and in West Virginia and Ohio in the Marcellus and Utica Shales (“Southwest Appalachia”) and include working interests in approximately 6,600 gross natural gas and oil wells. […] we completed the Southwestern Merger, creating a premier energy company that we believe is underpinned by a leading natural gas portfolio adjacent to the highest demand markets, premium inventory, a resilient financial foundation and an investment grade balance sheet.
p. 12 · Read in context →
Expand's interim CEO frames the demand backdrop — AI power, industrial reshoring and global LNG — and positions its Gulf Coast/Haynesville book, which it says holds 72% of the basin's lowest-breakeven inventory, to serve it.
Michael Wichterich, President & CEO (Interim) — prepared remarks: There is no disputing our industry is in the midst of a major demand growth. The big 3 drivers of demand, AI power, the reshoring of heavy industry and global LNG growth are converging to make the future bright for natural gas. […] For example, our Gulf Coast assets sit at the epicenter of LNG. In fact, our largest customers today are LNG facilities, and there is an increasing recognition of the strength and competitive advantage of our Haynesville position. According to third-party reports, today, we own 72% of the lowest breakeven inventory in the basin, allowing us to deliver certified natural gas directly to LNG facilities with minimal risk of basis blowouts.
p. 1 · Read in context →
Expand's CEO quantifies the Haynesville cost advantage — 7 rigs doing what took 13 in 2023, well costs it says run 30% below peers, and sub-$2.75 breakevens — the low-cost-of-supply contest EQT competes on from Appalachia.
Domenic "Nick" Dell'Osso, CEO — prepared remarks: Today, we can deliver with 7 rigs, the same production it took 13 rigs to deliver in 2023. Since then, we have reduced well costs by greater than 25%, and year-to-date, our costs are 30% lower than peers based on third-party well proposals. […] These efficiency gains are sustainable and deliver significant improvement to our breakevens, which today average less than $2.75 across the basin.
p. 1 · Read in context →
Antero Resources (AR) (AR)
A core-Appalachia Marcellus/Utica gas-and-NGL producer whose West Virginia acreage sits adjacent to EQT's; it competes for the same in-basin demand and pipeline capacity and, like EQT, argues integrated development is essential in Appalachia. Featured on its Appalachian positioning, its integrated-model and inventory claims and its demand read; the NGL/LPG export franchise appears only where it frames positioning.
Antero's stated positioning among Appalachian gas producers — the highest LNG exposure at 2.3 Bcf/d — and, on liquids, its claim to be the largest US producer-exporter of NGLs.
Michael N. Kennedy, President & CEO — prepared remarks: We have the highest LNG exposure among Appalachian producers, selling 2.3 Bcf per day of production to sales points along the LNG fairway. At the same time, we are the largest producer-exporter of NGLs in the U.S., selling the majority of our LPG, which includes propane and butane, into international markets.
p. 2 · Read in context →
Antero's core Marcellus/West Virginia inventory (expanded by the HG Acquisition) and its argument — mirroring EQT's — that integrated development is critical in Appalachia for capital-efficient development and price realizations.
Form 10-K, Item 1 — Business Strategy and Competitive Strengths: We have assembled a portfolio of long lived properties primarily in the core of the Marcellus Shale in West Virginia that are characterized by what we believe to be high repeatability and low geologic risk. The HG Acquisition expands our core position in West Virginia, where we have a substantial inventory of liquids-rich and dry gas locations. […] We believe it is critical in Appalachia to have integrated development of the resources in order to have the most capital efficient development and maximize price realizations.
p. 12 · Read in context →
Antero sizes recent in-region gas-supply RFPs at over 5 Bcf/d and frames its multi-decade inventory and investment-grade balance sheet as the qualification to serve that demand.
Brendan E. Krueger, CFO — prepared remarks: in just the last few months alone, we have participated in requests to provide proposals for gas supply that total over 5 Bcf per day. […] we do believe the demand is only growing for natural gas, and particularly natural gas that can be supplied by an investment grade producer with multiple decades of undeveloped inventory.
p. 4 · Read in context →
Range Resources (RRC) (RRC)
A Marcellus pure-play in EQT's core Southwest Pennsylvania footprint, competing for the same in-basin power/data-center demand and pipeline access — and it names EQT directly in its dry-gas peer group. Featured on its demand read, its lowest-cost/long-inventory claims and its explicit peer-set naming.
Range's demand map — record LNG exports, feed-gas demand it expects to exceed 30 Bcf/d by 2031, and ~2.5 Bcf/d of potential Northeast data-center demand by decade-end — the same structural backdrop underpinning EQT's thesis.
Dennis Degner, CEO — prepared remarks: The U.S. exported record volumes of LNG in the third quarter as new capacity continued to be commercialized and international demand for clean, reliable American energy remains strong. […] Based on projects under construction, LNG feed gas demand is expected to exceed 30 Bcf per day by 2031, more than doubling the export capacity versus current levels. […] consensus estimates for approximately 2.5 Bcf per day of Northeastern demand potential from data centers by the end of the decade are becoming more real.
p. 2 · Read in context →
Range's self-described strategy — lowest-in-industry cost to find and produce, ~27 million lateral feet of remaining Marcellus inventory, and low-decline, long-life reserves — the low-cost, low-reinvestment claims that parallel EQT's.
Form 10-K, Item 1 — Business Strategy: We endeavor to control costs such that our cost to find, develop and produce natural gas, NGLs and oil is one of the lowest in the industry. […] Currently, we have an estimated 27 million lateral feet of drilling inventory remaining in the Marcellus Shale, both proved and unproved. […] Long-life reserves with relatively low decline rates reduce reinvestment risk as they lessen the amount of reinvestment capital deployed each year to replace production.
p. 9 · Read in context →
Range's self-constructed peer group names EQT directly — and double-weights it as one of the six highest dry-gas-reserve peers — an explicit identification of EQT as a direct comparator.
Form 10-K, Item 5 — Stockholder Return Performance (peer-group footnote): the following thirteen companies: Antero Resources Corporation, Civitas Resources, Inc., Chord Energy Corporation, CNX Resources Corporation, Comstock Resources, Inc., Coterra Energy, Inc., EQT Corporation, Expand Energy Corporation […] The six companies included twice are Antero Resources Corporation, CNX Resources Corporation, Comstock Resources, Inc., Coterra Energy Inc., EQT Corporation and Expand Energy Corporation.
p. 38 · Read in context →
CNX Resources (CNX) (CNX)
An Appalachian Marcellus/Utica gas producer in EQT's home basin, competing for the same in-basin power and data-center demand and naming EQT in its own TSR peer group. Featured on its demand read, its basin/low-cost positioning and its peer-set naming; coalbed methane and new-technologies ventures are context only.
Asked about competitors' 10-plus-Bcf/d in-basin demand calls, CNX's CEO argues Appalachian demand will need multiple producers and that resource depth and creditworthiness decide who wins long-term supply deals.
Alan Shepard, President & CEO — Q&A with Michael Scialla (Stephens): The magnitude of gas that will be demanded in-basin in Appalachia is going to need to be sourced by multiple producers. If you think about folks like us that have the resource depth and the creditworthiness to enter into long-term arrangements with these new demand sources, we will certainly benefit. The only question in my mind is timing: is it three years, five years, or seven years?
p. 3 · Read in context →
CNX lists its competitive advantages — HBP acreage, midstream ownership, low-cost operations — and sizes the Appalachian Basin as, in its view, one of the largest and most efficient gas sources in the world.
Form 10-K, Item 1 — Business: We believe that our extensive held-by-production acreage position and development inventory, combined with our regional operating expertise, extensive data set from development and non-operational participation wells, midstream infrastructure ownership, low-cost operations and legacy surface acreage position provide us with significant competitive advantages that position us for long-term value creation. […] CNX has the benefit of having its operations centered in the Appalachian Basin, which the Company believes is one of the largest, most efficient, and environmentally sustainable sources of natural gas in the world.
p. 6 · Read in context →
CNX names EQT in its six-company Appalachian gas peer group for total-shareholder-return benchmarking (the accompanying table shows CNX at 340.8 vs. the peer group at 531.8 over 2020–2025).
Form 10-K, Item 5 — Performance Graph (peer group): The current peer group is comprised of CNX, Antero Resources Corporation, Expand Energy Corporation, EQT Corporation, Gulfport Energy Corporation and Range Resources Corporation.
p. 43 · Read in context →
Coterra Energy (CTRA) (CTRA)
A multi-basin producer whose Marcellus gas competes directly with EQT while its Permian oil lets it flex capital toward or away from gas with the macro; the market benchmarks it explicitly against EQT. Featured on the analyst comparison to EQT and on its gas-demand read; Permian/Anadarko oil operations appear only as capital-allocation context.
Coterra's read on gas demand — Gulf Coast LNG ramping to record flows and new in-basin power-generation calls — that it says positions its portfolio, including Marcellus gas, to respond.
Blake Sirgo, SVP Operations — prepared remarks: The ramp of Gulf Coast LNG has begun with record flows in February. […] We are seeing new calls on natural gas for power generation in the basins we operate in. We are working with power providers and power consumers to see how Coterra Gas can help generate the electrons they require. Coterra is well-positioned and poised to take advantage of this expected power demand across our portfolio.
p. 4 · Read in context →
Comstock Resources (CRK) (CRK)
A scaled Haynesville pure-play that competes with EQT for the same LNG-export and data-center gas demand, but from a Gulf-Coast-proximate basin rather than Appalachia — the alternative supply source EQT's gas clears against. Featured on its Haynesville scale and proximity advantage and its demand thesis; Western Haynesville exploration is context.
Comstock positions itself as a leading Haynesville producer whose Gulf Coast proximity gives it access to LNG-export, data-center and petrochemical demand — a competing, LNG-adjacent supply basin to EQT's Appalachia.
Form 10-K, Item 1 — Business: We are a leading independent natural gas producer operating primarily in the Haynesville shale, a premier natural gas basin located in North Louisiana and East Texas with superior economics given its geographical proximity to the Gulf Coast natural gas markets. […] Our Haynesville and Bossier shale acreage is located in one of the premier North American natural gas basins and has access to the growing natural gas demand in the Gulf Coast markets related to LNG exports, expansion of power generation for data centers and the petrochemical industry due to its geographic proximity.
p. 8 · Read in context →
Comstock's CEO frames record LNG exports (a cited 18.7 Bcf/d high) and AI/data-center power as the demand pull, with the Haynesville "on the front line" to supply it.
Jay Allison, Chairman & CEO — prepared remarks: Natural gas has become the go-to energy source in the United States, driven by the growth in LNG exports and the push to generate power for AI and data center development. I noticed yesterday that LNG exports reached a record high of 18.7 Bcf and the journal is full of articles on the impact of AI and data centers on future power demand. The Haynesville Shale is on the front line to deliver the gas supply to meet the growing demand.
p. 1 · Read in context →
More peer documents
Q4_FY2025 — 13 pages · Management sizes ~25 Bcf/d of incoming US gas demand (about half from LNG) plus Virginia data-center load — Expand's fuller demand-sizing exhibit. · Open →
Q4_FY2025 — 13 pages · SVP Justin Fowler on regional power/data-center demand growth along Antero's firm-transport corridor and looming basin supply challenges — direct in-basin collision with EQT. · Open →
Q1_FY2026 — 13 pages · CEO Allison calls the Haynesville the most important basin for Gulf Coast LNG and data centers and stakes a lowest-cost, demand-proximate value claim. · Open →
Fit
Does not fit the framework (P1 not met)
EQT clears the universe and trips no exclusion, but the year-10 durability gate — the one pure gate — does not clear, so the overall read is Does not fit the framework. Confidence is medium: the jury agreed across families on every gate criterion, and the basis the tally records is that probability spreads were at most 0.25 or one non-load-bearing criterion was contested. No flags are raised — not watchlist-only, no exclusion hits, no China-sensitivity flag, and no prior-driven-risk flag.
Universe and exclusions — unsoftened
EQT passes both universe lines cleanly. It is US-domiciled common stock on the NYSE (ticker EQT, SEC CIK 33213) — not an ADR and not a Chinese issuer — so the geography line holds; the identity rests on the SEC-sourced record because live web re-verification was unavailable this run. Market capitalization is about $32.8B (615.717M diluted shares [1] at the 2026-07-31 close of $53.29), clearing the $10B floor by 3.3x. Here is the plain-words point on that pass: the $32.8B is not organic scaling — it sits on roughly $8.6B of gas sales because the share count more than tripled from 167M (2016) to 615.7M (2025) [2]. The universe test is about size, and on size it passes.
No exclusion hit fires. The checks and what each found:
- Auto OEM (X1) — clean. EQT is a natural-gas production and midstream company; it manufactures no vehicles [3].
- Promotion pattern (X2) — checked, not a hit. Both prongs must be evidenced. On delivery, most resolved commitments were met or beaten (deleveraging from ~$13.7B toward $5B; $4.7B of asset sales closed a year early), with one miss — net debt landing ~$7.7B versus a ~$7B target, to fund the Olympus acquisition. Founder-CEO Toby Rice holds a nine-figure stake (2,454,427 shares plus 1,000,000 options), but all 17 directors and officers together hold under 1% of the class [4]. The counter-fact in the same breath: escalating language such as "transformation now complete," paired with sub-1% insider ownership and an ever-rising share count, is a real governance caution [5] — but delivery held, so the exclusion does not trigger.
- Structural decline (X3) — checked, absent. The disqualifier (three consecutive years of high-single-digit revenue decline) does not fire, and production volume rose 2,016 → 2,228 → 2,382 Bcfe (FY2023–FY2025). The counter-fact: revenue is violently cyclical (down 58% in FY2023), but the declines are price-driven and non-consecutive, not a structural bleed [6].
- Consensus-saturated story (X4) — clean. EQT trades at ~6.9x EV/EBITDA, ~16x earnings and ~3.8x sales — cyclical-commodity multiples, the opposite of an extreme multiple-to-sales darling. EV of $40.5B ($32.8B market cap + $7.69B net debt) over FY2025 EBITDA of $5.85B (operating income $3,249.6M [7] plus depreciation, depletion and amortization of $2,600.4M) is 6.9x. The counter-fact: an "AI data centers and LNG" demand narrative is attached to the name and appears in EQT's own strategy language [8], which bears watching for sentiment even though the current multiple does not reflect it.
- China dependence (S1) — clean, no flag. All reserves, wells and pipelines are in PA/WV/OH [9] and revenue is domestic wholesale gas; 94% of employees sit in PA/WV/TX/OH [10]. LNG exports give indirect global price exposure but no direct China revenue or asset concentration.
Pattern match
EQT fits none of the four recognition setups cleanly. It is not a large bank at the bottom of a credit cycle; it is not a high-dividend-yield case (the ~1.2% dividend is immaterial); it is not a healthcare/insurance forecasting error; and it is not a quality tech monopoly on a fear dip. The nearest adjacency is the fourth setup — a large, essential business on a fear-driven dip — but the two checks that setup demands both fail here: there was no capitulation (the fall carried no volume spike) and there was no discrete adverse event (see the Dislocation treatment). What EQT actually is, in framework terms, is a commodity cyclical whose drawdown tracked a softening gas strip rather than a repricing of a temporary earnings anchor — closer to the "cheap on FCF yield" trap the framework is built to screen out than to any of the four setups it hunts.
The pillar ledger
Year-10 durability (P1) — the gate — not met
This is the decisive point. The gate asks whether year-10 revenue and adjusted free cash flow will both be higher than today's with very high conviction. The volume leg is credible: 28,046 Bcfe of proved reserves (93% Marcellus), roughly 30 years of inventory, and production rising three years running [11]. The price leg is where the gate fails. Revenue equals that volume times a commodity price EQT is a price-taker on and states it is "unable to predict" [12]; it "typically receive[s] market-based pricing" at a structurally negative Appalachian basis [13]. That price ranged $2.65–$9.86/MMBtu in 2025 alone and drove revenue from $12,114M in FY2022 [14] to $5,045M in FY2023, a 58% one-year fall [15]. There is also no market-structure moat: EQT calls itself the "only large-scale, integrated" US gas producer [16], yet at ~6% of US output it is a price-taker in a fragmented field, and Expand Energy claims the "largest independent" title outright [17]. The strongest surviving counter-fact sits in the same treatment: production is rising, 4.5 MTPA of LNG offtake is signed for 2030–2031, and integrated midstream defended a record $2.84B FCF in 2025 — so if gas merely holds near mid-cycle, both legs clear comfortably [18]. The gate is binary by construction, and genuine doubt on the price leg resolves it to not met (probability 0.53, spread 0.10, cross-family agreement). Full treatment: Durability. Reference line: revenue and adjusted FCF both higher in 2036 with very high conviction — the position is short of it on the price leg.
FCF consistency (P2) — not met
The framework's stability metric is adjusted FCF's rolling 5-year average; it is not computable here because stock-based compensation is missing for every year 2016–2025 in the feed. Reported FCF is genuinely unpredictable rather than a stable annuity: it swung from −$23M (FY2018) to $2,838M (FY2025) [19]. The counter-fact in the same breath: the reported rolling 5-year average does trend up ($184M → $1,449M across FY2020–FY2025), and the single negative year coincided with $3.0B of peak growth capex, not an operating failure. Full treatment: Durability.
Dislocation and yield (P3) — event and capitulation not met; yield short of bar; forward path met
P3a (identifiable event) is not met: the 28% fall from the 25 March 2026 all-time high carried no guidance cut, miss, or regulatory shock — Q1 2026 was a record $1.83B FCF and an 11% EPS beat [20] — and instead tracked a softer gas strip ($2.89/MMBtu in Q2) [21]. P3b (capitulation) is not met: peak 20-day average volume through the fall was 0.98x the pre-peak median, and the busiest single session reached only 1.64x — orderly selling, not a wash-out. P3c (yield vs bar) is not met: on adjusted FCF (reported FCF − SBC − 5-year average cash acquisitions), EQT yields 5.6% on FY2025 and 1.6% on the three-year average against the 10% default line — 440 bps and 840 bps short. The FY2025 arithmetic: reported $2,837.5M − SBC $60.8M − 5-year-average acquisitions $943.1M = $1,833.7M, over $32,811.6M = 5.59% [22]. The bar is the 10% moderate line because net debt/EBITDA is 1.31x ($7.69B / $5.85B) [23], not the softer 8–9% fortress line where the 8.6% reported yield would nearly clear. P3d (forward path) is met (probability 0.56, spread 0.05): consensus reported FCF yield reaches 11.7% by FY2028 and the adjusted basis crosses ~10.7% around then as the 2021–2024 acquisition dock ages off the trailing average — but only if EQT stops making large cash acquisitions, which it has not (Olympus closed July 2025) [24]. Full treatments: Dislocation and Yield. Note that adjusted FCF, its yield, balance-sheet class and yield baseline all returned not_computable in the deterministic feature file (SBC missing every year, EBITDA missing FY2025); the figures above are reconstructed from the filed 10-K cash-flow statements and flagged as such.
Balance sheet and self-help (P4) — outlast met; repurchase engine not met
P4a (outlast + allocation headroom) is met: EQT is investment-grade with a laddered senior-note schedule (~$7.5B total, largest single year $1.65B in 2029) [25], a $3.5B undrawn revolver [26], and net debt cut toward a $5.0B target [27]. The vote split here is worth stating: three seats read this met, one not met, so cross-family agreement is absent — the counter-fact is that in FY2024–FY2025 allocation went entirely to debt paydown and asset sales with zero buybacks, the forced-toward-debt pattern the framework flags. P4b (repurchase engine) is not met: the engine runs backwards. Shares rose 3.7x from 166.978M (2016) to 615.717M (2025) on serial all-stock acquisitions, while cumulative buybacks since 2021 were just $622M and zero in both FY2024 and FY2025 [28]. The counter-fact: management now frames aggressive countercyclical buybacks as its next lever and is willing to hold "up to a few billion dollars" of cash for them [29], but the framework rewards a demonstrated habit, not a stated one, and the levered exception (≥25% yield plus a multi-year share-count reduction) fails on both legs. P4c (dividend cover) is not applicable: the ~1.2% dividend ($0.66 annualized, covered ~7x by FY2025 FCF) is not part of the return case [30]. Full treatment: Self-Help.
Diagnosis (P5) — met (temporary lean), but a live permanent tail
The adversarial trial put the probability the impairment is temporary at 0.71 (mean 0.66, spread 0.16, per-judge 0.56–0.72, order-stability gap 0.07), recorded as not contested. The driver that broke is simply the realized gas price ($2.89/MMBtu in Q2 2026), which mean-reverts on the LNG/power/data-center demand calendar [31]. The counter-fact in the same treatment is genuinely permanent and price-independent: proved reserves per diluted share fell 32%, from ~66.8 Mcfe (FY2023) [32] to ~45.6 Mcfe (FY2025), as the share count rose with no repurchases to offset it [33]; one judge sat at 0.56, and the tally logs a temporary-side quote-check failure, so the 0.29 permanent tail is substantive rather than nominal. P5 is met on the framework's threshold but does not offset the gate. Full treatment: Damage Math.
Instrument context (I1) — not verifiable
Long-dated listed options exist (January 2028 LEAPS, ~17 months of tenor) and 30-day implied volatility was 27.1% as of 2026-07-31 — well inside the framework's ~50–55 acceptable line. But precise current open interest could not be verified from an accessible citable source, so the criterion is recorded not_verifiable. This never blocks the pillar verdicts; it would only drive a watchlist-only overlay if the pillars otherwise fit. Full treatment: Clock.
What a 3x-in-3-years would require
The tally's re-rating math is unavailable, and this is rendered exactly as it stands: the applicable bar and the normalized adjusted FCF are both missing, because adjusted FCF, adjusted-FCF yield and balance-sheet class all returned not_computable in the deterministic feature file (SBC missing every year, EBITDA missing FY2025). No price-at-bar-yield on normalized adjusted FCF can be computed from the record of this run.
The closest available arithmetic comes from the Damage Math tab's DCF-lite, which is calibrated to the tape rather than to the framework bar: a 10% no-growth capitalization of ~$3.3B normalized FCF gives ~$33.0B, essentially the current $32.8B market cap — so the price already embeds roughly mid-cycle cash with no growth. For base-rate context, EQT's own history (the Clock tab) shows four drawdowns of ~28–43% in the post-2020 pure-play era, recovering from trough to prior peak in ~3 to ~28 months depending on the gas cycle; the current 28% episode is the shallowest of that set and has already retraced ~9%. A framework-style 3x is not supported by this arithmetic: the entry yield is below the bar, the dislocation is mild, and the re-rating lever is an undated commodity price rather than a scheduled catalyst.
Contested and undetermined
Nothing was contested and nothing was cannot-determine. The tally records no contested criteria and no criterion resolved to cannot_determine. Two criteria carry an internal split without changing the aggregate: P4a met on a 3–1 seat split (no cross-family agreement), and P4a's masked-probe seat read not_met while the open seats read met — noted here for completeness, not as a contested verdict. I1 is recorded not_verifiable (open interest not citable), which is a data limitation rather than a contested reading.
Provenance
Source: the report's deterministic verdict tally and jury records.
Two independent model families supplied four voting seats plus a name-masked probe; they agreed on every gate criterion, and masking the company's name barely moved any probability (gap 0.01), so the verdict is not an artifact of the models recognizing EQT. The one load-bearing probability with meaningful disagreement is the diagnosis (spread 0.16), and even there the order-stability gap of 0.07 shows the trial ruling did not depend on which brief the judges read first.
The falsifier ledger
These are the standing what-would-change-this conditions carried verbatim from the tally — the framework's five templates first, then the name-specific thresholds, directions, and windows the jury and trial recorded (several overlap because more than one seat contributed):
Data gaps
The run could not resolve the following, from the tally's list:
- Adjusted FCF (FCF − SBC − 5-year-average acquisitions) is not_computable: SBC is missing for every fiscal year 2016–2025 in the feed, so the framework's core FCF measure, its yield, yield baseline, float-retirement years and FCF stability all return not_computable; the figures on this tab are reconstructed from the filed 10-K cash-flow statements.
- Balance-sheet class returned "unknown" (EBITDA missing for FY2025), so net-debt/EBITDA leverage class could not be computed deterministically; EBITDA was computed here as operating income plus depreciation, depletion and amortization (1.31x, moderate band).
- Live, dated web verification of current market cap, exact float, and sell-side consensus positioning was unavailable (web-research preload failed on provider credits); universe facts rest on the feature file (priced 2026-07-31) and the SEC identity record.
- Peer valuation multiples (EV/EBITDA for AR, RRC, CNX, CTRA, EXE, CRK) could not be computed — peer financials were empty in this run — so the not-darling read is anchored to EQT's own multiples and revenue shape rather than a peer table.
- Precise current listed-options open interest / liquidity depth was not verifiable from a citable source (option pages blocked automated access); LEAPS existence and dated IV levels were verifiable, but open interest is stated qualitatively only.
- Reported short interest, borrow pressure, and public net-short disclosures are all unavailable for EQT in this run, so short-side seller composition and any crowding cannot be characterized.
- The framework's acquisition dock is cash-based only; EQT's largest deals (Alta, Tug Hill, Equitrans, Olympus) were substantially stock-funded and are invisible to the FCF adjustment — captured only via the share-count trend.
- Natural-gas forward-strip and winter-2026-27 weather/storage assumptions that would date the near-term commodity catalyst are not in the corpus; the near-term re-rating timing is bounded but not pinned.
Business — EQT Corporation
EQT is the largest US natural gas producer, a vertically integrated Appalachian operator that pumped roughly 6.5 Bcfe per day in 2025 and sits on 28.0 Tcfe of proved reserves, 93% in the Marcellus [1] [2]. It clears both universe lines cleanly: NYSE-listed common stock, ~$32.8B market cap. It is a commodity price-taker at ~6% of US output — a fragmented industry, not a franchise. No auto, no China, no darling multiple.
The universe screen
EQT Corporation trades on the New York Stock Exchange under the ticker EQT (SEC CIK 33213, MIC XNYS) — US-domiciled common stock, not an ADR and not a Chinese issuer, so the geography line (U1) passes without qualification. On the pricing line (U2), the shares closed at $53.29 on July 31, 2026 against 615.7 million shares outstanding, a market capitalization of about $32.8B — comfortably above the $10B floor.
Market Cap ($B) — Jul 31 2026
Universe Floor ($B)
Source: derived from fit_features.market_cap_usd (price $53.29 on 2026-07-31 × 615.7M shares); listing identity per data/company.json (NYSE, CIK 33213). Live web verification was unavailable this run, so both facts rest on the dated feature file and the SEC-sourced identity record.
Both universe checks pass. The framework question is therefore not whether EQT belongs in the universe — it does — but how its business holds up on the durability and yield pillars, which the Durability and Yield tabs carry.
What EQT is — orienting from zero
EQT explores for, develops, and produces natural gas in the Appalachian Basin, and since July 2024 also owns the pipes that move it. It describes itself as "a vertically integrated natural gas company with upstream, gathering and transmission operations focused in the Appalachian Basin," holding 28.0 Tcfe of proved reserves across ~2.3 million gross acres and ~2,945 miles of pipeline as of year-end 2025 [3]. Over 90% of volume is natural gas; the rest is natural gas liquids and a sliver of oil.
The money is made on a simple spread: pull gas out of the ground at a low cost per unit, move it to market through owned infrastructure, and sell it at the prevailing commodity price. In 2025 EQT sold 2,382 Bcfe (about 6,527 MMcfe per day) at an average sales price of $3.24 per Mcfe, up 46.6% from $2.21 in 2024 — the swing that carried operating income from $685M to $3,250M and basic EPS from $0.45 to $3.33 [4] [5]. That single-year doubling of earnings on a one-dollar move in the gas price is the whole business in miniature: the company controls its costs, not its revenue.
Total Revenue FY2025 ($M)
Net Income FY2025 ($M)
Production (MMcfe/d)
Proved Reserves (Tcfe)
Employees
Source: FY2025 Annual Report (Form 10-K) — total operating revenues and net income attributable to EQT [6]; volume p.97 [7]; reserves p.15 [8]; employees p.44 [9].
Segments and their economics
EQT reports three segments, and effectively one business. Upstream — the wells — generated $2,318M of segment operating income in 2025. Gathering (the low-pressure pipes that collect gas from wells) and Transmission (the higher-pressure lines and storage that carry it toward interstate markets) added $837M and $375M, but roughly three-quarters of Gathering throughput and revenue is EQT's own upstream gas moving through EQT's own pipes [10] [11]. The midstream segments are less a separate profit center than a cost lever: owning the infrastructure it used to rent lowers EQT's gathering and transmission expense and its free-cash-flow breakeven price.
Source: FY2025 Annual Report (Form 10-K), Note 2 — Financial Information by Business Segment (segment figures before intersegment eliminations) [12].
Geography and customers
The footprint is entirely domestic and highly concentrated. All reserves sit in Pennsylvania (17,253 Bcfe), West Virginia (9,927 Bcfe), and Ohio (866 Bcfe); 93% of total proved reserves are in the Marcellus Shale [13]. Of 1,523 full-time employees, none unionized, 94% live in Pennsylvania, West Virginia, Texas, or Ohio [14]. EQT sells to marketers, utilities, and industrial buyers, with growing pull cited from power generation, domestic data centers, and LNG exports [15].
Scale and history
EQT reached its current size by acquisition. It became America's largest gas producer with the 2017 Rice Energy deal, integrated midstream via the July 2024 all-stock Equitrans Midstream acquisition, and added the Olympus Energy assets in 2025 [16] [17]. That stock-funded roll-up shows up in the share count, which rose from 167 million in 2016 to 615.7 million in 2025 — a 5-year compound growth of 18.8% (per fit_features.share_count_trend). That trajectory, and whether it has stopped, is a capital-allocation question the Self-Help tab carries; here it is only the mechanical explanation of how a company with ~$8B of gas sales carries a ~$33B equity value.
The balance sheet is investment-grade with net debt of about $7.7B; management published a plan to cut debt toward $7.5B by end-2025 and a long-term goal of $5.0B, and guided 2026 capital spending of $2.65–2.85B on 2,275–2,375 Bcfe of volume [18].
Market structure — the raw material for durability
This is the section the durability jury will lean on, so it is worth stating plainly. On volume, EQT is the largest natural gas producer in the United States — a title it held explicitly in its FY2021–FY2023 filings ("based on average daily sales volume, we are the largest producer of natural gas in the United States") and now shares with Expand Energy after the 2024 Chesapeake–Southwestern merger [19]. But "largest" here is a scale ranking, not a share of a controllable market.
Being the largest producer of US natural gas means owning roughly 6% of national output. EQT and its own investor materials put its share at about 6% of total US natural gas production, with the whole Appalachian Basin at about one-third of US supply. On that base, if EQT were a country it would rank as the world's 13th-largest gas producer — and still be a price-taker.
Source: EQT investor presentation, Q3 FY2023 ("~6% of total US production") [20]; company website scale statistics [21].
Structure: fragmented, price-taking. The US natural gas market is a deep, liquid commodity in which no producer sets the price. EQT's own competition disclosure names the field it fights in: "independent oil and gas companies, major oil and gas companies, individual producers, operators and marketing companies and other energy companies that produce substitutes" — competing on the acquisition of properties, the development of reserves, and the securing of services, labor, and transportation [22]. There is no monopoly, duopoly, or oligopoly to point to on the commodity itself: the closest Appalachian pure-play peers are Antero (AR), Range Resources (RRC), CNX, and Coterra (CTRA), with Expand Energy (EXE) and Comstock (CRK) competing for the same LNG and power demand from other basins.
Source: EQT competitor set, derived from the FY2025 10-K competition disclosure and the run's peer selection [23].
What durability rests on instead. With no pricing power over the commodity, EQT's year-10 conviction case cannot come from market structure — it has to come from the three durability supports that a fragmented commodity business can still own. First, capital intensity and scale as a cost moat: EQT's strategy is to be "the leading low-cost producer of natural gas," and integrating Equitrans put the gathering and transmission cost line under its own control [24]. Second, essentiality: natural gas is a base-load fuel for heating, power, and industry, with new demand pull from data centers and LNG. Third, operating history and inventory: a multi-decade Appalachian operator with 28.0 Tcfe of proved reserves and a deep drilling inventory, of which zero proved-undeveloped locations have sat undeveloped beyond five years [25]. Entry barriers are real but partial: FERC and state environmental permitting gate new pipelines and drilling, yet nothing stops a well-capitalized rival from drilling the same rock. The evidence here is laid out for the Durability tab to weigh; the honest summary is that EQT's moat is cost-and-scale within a commodity, not structure over a market.
First-pass exclusion screen
Auto / OEM (X1) — clear. EQT is a natural gas exploration-and-production and midstream company; it manufactures nothing and sells no vehicles. The car-company exclusion does not apply.
China dependence (S1) — absent. Every reserve, well, and pipeline is in Pennsylvania, West Virginia, or Ohio, and 94% of employees live in those states plus Texas [26] [27]. Revenue is US wholesale gas and NGLs sold to domestic marketers, utilities, and industrials, with LNG providing indirect international demand at the margin. Direct China revenue or asset dependence is effectively nil.
Darling positioning (X4) — does not fire. EQT is not priced as a consensus growth darling. Against the ~$32.8B market cap and ~$7.7B net debt, enterprise value is roughly $40.5B; on FY2025 EBITDA of about $5.85B (operating income of $3.25B plus $2.6B of depreciation, depletion and amortization) that is an EV/EBITDA of roughly 6.9x, with a trailing price-to-earnings of about 16x on $3.33 of EPS and price-to-sales near 4x. Those are cyclical-commodity multiples, not a "multiple-to-sales" darling profile, and the shape is the opposite of a bottom-left-to-top-right chart: revenue swung from $12.1B of gas sales in 2022 to $5.0B in 2023 before recovering. A data-center-and-LNG demand narrative does exist around the name and is worth watching for sentiment, but the valuation does not reflect one.
Source: FY2019–FY2023 per fit_features.revenue_trajectory (sales of natural gas, NGLs and oil); FY2024–FY2025 per FY2025 Annual Report (Form 10-K), Statements of Consolidated Operations [28].
The promotional-CEO check (X2) and the structural-decline question (X3) are not settled here — they belong to the Self-Help and Durability tabs — but nothing in the business description forces either flag. One fact does travel forward regardless of whose brief owns it: the share count has more than tripled since 2016 on stock-funded acquisitions, which the framework treats as material to whether the buyback flywheel can work.
Dislocation
EQT fell 28% from an all-time-high close of $67.93 on 25 March 2026 to $48.85 on 10 July, and has since recovered to $53.29. But the anatomy does not match the framework's entry trigger. There was no dated adverse company event — EQT beat in Q1 and posted record free cash flow while the fall ran; the slide tracked a softening natural-gas strip. Traded volume never spiked (peak 20-day average was 0.98x its pre-peak median), so the selling was orderly, not capitulation. Measured against February — before the winter price spike — the stock is roughly flat while forward EPS estimates fell ~17%.
The drawdown, quantified
Peak (25 Mar 2026)
Trough (10 Jul 2026)
Current (31 Jul 2026)
Peak to Trough
Current vs Peak
Source: capitulation gauge derived from daily price data (fit_features.capitulation_gauge); market data as reported.
The fit_features capitulation gauge is the source of record: peak close $67.93 on 25 March 2026, trough close $48.85 on 10 July, a decline of 28.1% over 107 days, with the current close of $53.29 leaving the stock 21.6% below the peak and 9.1% above the trough. The peak is also EQT's all-time-high close and its 52-week high — the drawdown is measured off a record, not off a level the stock had held for any length of time.
Source: daily price data as reported; peak and trough per fit_features.capitulation_gauge.
The fall came in one modest leg and a long grind, not a single break. The stock lost roughly 12% in the week after the 25 March peak (to about $59.70 by 2 April), then ground lower over three months — through the high-$50s in April, the mid-$50s in May, the low-$50s in June — reaching the $48.85 trough on 10 July before recovering. No single session carried an event-sized move down; the largest one-day decline in the window was ordinary for a commodity producer.
Set against a longer frame, the "drawdown" is largely a round-trip. EQT opened 2026 at $53.46, spiked to its record on a cold-winter gas move, and has returned to $53.29 — essentially flat year-to-date and about 2% above where it traded a year ago ($52.34 on 1 August 2025). What repriced was a transient winter high, not a durable valuation.
The trigger — a softening gas strip, not a company event
The framework's trigger is an identifiable, dated adverse event that fear then extends. EQT has none. Across the fall the company's own news flow was uniformly constructive, and the two earnings prints that landed inside the window were a beat and a near-inline result:
Source: consensus vs reported EPS, earnings calendar as reported.
Q1 2026, reported 21 April as the stock was already falling, was a record: more than $1.83 billion of free cash flow and $2.33 of EPS, an 11% beat [1]. The Q2 print on 21 July — after the 10 July trough — missed by a rounding-error 3.3% on EPS while production came in above guidance. Neither is a guidance cut, an 8-K shock, or a regulatory action.
What did move was the commodity. Natural gas prices "averaged just $2.89 per MMBtu during the quarter" in Q2, management noted, framing the weakness as the industry backdrop rather than anything specific to EQT [2]. The stock's late-March peak coincided with the tail of winter withdrawal season; the subsequent grind lower matches the seasonal softening of gas through spring and summer. This is a commodity-price drift shared across Appalachian gas producers — not a company-specific dislocation with a dated cause.
The fear gauge — no capitulation
Peak 20d Avg Volume ÷ Pre-Peak Median
Largest Single-Day Volume Multiple
Source: fit_features.capitulation_gauge.volume_spike; single-day figure derived from daily volume data.
The framework requires a volume spike — emotion-driven, capitulatory selling at peak fear, not the orderly bleed of a first 10–20% drift. EQT shows the opposite. The gauge measures the highest 20-day average volume during the peak-to-trough leg against the median daily volume over the 180 days before the peak, and that ratio is 0.98x — trading through the fall was, if anything, marginally lighter than normal. Even the single busiest session in the window (18 June) reached only 1.64x the pre-peak median — brisk, but nowhere near the multiples that mark a wash-out. On this measure the fall reads as steady repricing, not fear.
Estimates versus price — estimates fell faster than the price held
The framework's signature is a price fall that outruns the estimate cut. EQT's window shows close to the reverse. Pairing each consensus snapshot with the stock on the same date:
Source: consensus EPS revision snapshots (data/sp/estimates.json via fit_features.consensus_forward_yield); prices as reported.
From the 2 February snapshot to now, the FY2027 EPS estimate fell from $4.77 to $3.98 — down 16.6%, with most of the cut arriving in July as the forward strip weakened. Over the identical span the stock went from $54.75 to $53.29, down 2.7%. Anchored to February — before the fleeting winter spike — the price has held up better than the earnings line beneath it, not overshot it. The 28% peak-to-trough figure exists only because the peak was a transient record; on any steadier reference the price and the estimates have drifted down together with the gas curve, with the price the more resilient of the two.
Forward cash-flow estimates, notably, did not break. Consensus free cash flow computes to a 9.5% yield on the current $32.8 billion market cap for FY2026, 9.6% for FY2027, and 11.7% for FY2028 — the sell side is not modeling distress. That the sell side still clears the bar while the buy side sells is the makings of a setup; but with no capitulation and no discrete trigger, the entry condition itself is absent. The yield arithmetic and its adjustments are carried in Yield; the value-versus-damage comparison in Damage Math.
Who was selling
Direct evidence on the seller base is thin. Reported short-interest data is unavailable for EQT in this run — no level, no change, no borrow-pressure or public net-short disclosures — so the short side cannot be characterized. Insider activity through the drawdown was routine: equity grants and tax-withholding dispositions on vesting in February, and only small open-market sales, with no cluster of large insider selling into the fall. No index deletion, fund liquidation, or other forced or structural seller surfaced in the corpus or news. There is, in short, no evidence of the anchored or forced selling the framework hunts — consistent with the volume gauge, which shows no capitulation to be explained.
Management, for its part, is positioning to buy into weakness rather than sell it: EQT says it is "on the doorstep" of its $5 billion net-debt target and intends to "accumulate cash, which we plan to aggressively deploy into share buybacks during the industry's episodic down cycles" [3], keeping protections in place "so we can be aggressive with capital deployment if valuation dislocations occur" [4]. Whether that intent has met execution — against a share count that has risen every year — is examined in Self-Help.
Bottom line
The three parts of a dislocation are absent. There is no dated adverse event — the fall tracks a softening gas strip while EQT kept beating and posting record cash flow. There is no fear gauge — peak volume ran at 0.98x the pre-peak median, an orderly repricing rather than capitulation. And the price did not outrun the estimate cut — measured from before the winter spike, the stock is roughly flat while FY2027 EPS is down ~17%, so it is the more resilient of the two. What the numbers describe is a commodity producer round-tripping a transient all-time high, not a stock repriced by fear. The temporary-versus-permanent question does not arise here, because the framework's entry trigger is not met.
Damage Math
The drawdown erased roughly $9.0B of market value peak-to-current (−21.5%), and $11.8B (−28.1%) at the July trough. A conservative, probability-weighted DCF-lite puts the cash value actually destroyed at about $3–4.4B. The remaining ~$5–6B gap is real, but it rests entirely on the trial's 0.71 probability that the hit is temporary; at the 29% permanent tail — a 32% fall in reserves per share from dilution — the gap closes.
The whole tab is one piece of arithmetic: a numerator (how much earning power fell), a denominator (how much price fell), and the difference between them under two transparent scenarios. The diagnosis that picks between the scenarios is not mine — it is the trial's, ruled at a 0.71 probability the impairment is temporary.
The near-term hit — the numerator
The trigger was a commodity input, not a company event: Appalachian spot gas fell to $2.89/MMBtu through the Q2-2026 shoulder season. That flowed straight into the print. Second-quarter net income fell to $211 million, $0.34 per diluted share, from $784 million, $1.30 per diluted share a year earlier — the filing attributes the drop to "lower derivative gains and lower average realized natural gas prices" [1].
Consensus followed the print down — but only at the front. Over the 90 days into the trough, current-year (FY2026) normalized EPS was cut 14.4%, from $4.8543 to $4.1542; next-year (FY2027) fell 12.4%, from $5.0013 to $4.383 [2]. On the CapIQ vintage the FY2027 cut is deeper still, from $4.77 (as of 2026-02-02, near the price peak) to $3.98 now, −16.5%. FY2028, by contrast, barely moved — $5.19 to $5.16.
Source: consensus EPS-trend vintages, current vs 90 days ago [3]; FY2028 on CapIQ momentum series [4].
Two facts complicate the numerator, and both belong here. First, the cut is a front-end shave, not a level reset: even after the 14.4% cut, FY2026 EPS still sits 36% above the FY2025 actual of $3.05 [5]. Second, consensus free cash flow did not fall at all — it keeps rising across the forecast, $3.12B (2026) to $3.83B (2028), a 9.5%-to-11.7% yield on today's market cap [6]. And the company moved the other way from a company in distress: mid-drawdown it raised 2026 production guidance "by roughly 90 Bcfe at the midpoint" and lowered full-year capital [7].
Source: consensus forward FCF, converted to yield on the current $32.8B market cap [8]; yield derivation per fit_features.consensus_forward_yield.
So the numerator is genuinely two-sided. A single trough quarter and a front-loaded EPS cut are the marks of a short-term earnings effect; a flat-to-rising forward FCF strip and raised volume guidance say the earning power itself was not marked down. That tension is what the trial exists to resolve.
The price change — the denominator
The market did not shave the front end; it repriced the whole claim. From the 2026-03-25 peak of $67.93 to the 2026-07-31 close of $53.29 (prices per the daily feed; fit_features.capitulation_gauge), market capitalization fell $9.0B on a 615.7M diluted-share base [9] — −21.5%. At the 2026-07-10 trough of $48.85 the loss was $11.8B, −28.1%.
Enterprise value fell about as much, and not because debt grew — because it shrank. Net debt came down from $7.69B at December 31, 2025 to $5.54B at June 30, 2026, so EV compressed roughly in step with equity: from ~$47.5B at the March peak to ~$38.4B now, about −$9.1B [10]. A business deleveraging into its own drawdown is being valued as if its cash-generating capacity had permanently stepped down.
Mkt Cap Lost, Peak-Current ($B)
Drawdown, Peak-Current
FY26 Consensus FCF ($B)
FY26 FCF Yield
Sources: share count [11]; net-debt reconciliation [12]; consensus FCF [13].
Set the two moves side by side: consensus FY2026 EPS fell 14.4% and FY2027 fell 12–16%, while forward FCF rose and the market cap fell 21.5% (28.1% at the trough). Price fell more than the front-year earnings estimate, and in the opposite direction to forward cash flow. Whether that is an overshoot or a correct anticipation of a permanent step-down is the question the NPV arithmetic frames.
The NPV arithmetic — two scenarios
The method is deliberately transparent: value EQT as a perpetuity of normalized free cash flow, then ask how much each diagnosis subtracts from it. Assumptions, stated:
- Discount rate 10%. This is Ruchir's own yield reference bar. It is conservative for a commodity E&P (12%+ is defensible), and a lower rate makes the permanent-damage perpetuity larger, so it works against finding a mispricing.
- Normalized (mid-cycle) FCF $3.3B — the average of consensus FCF for 2026–2029 ($3.12B, $3.14B, $3.83B, $3.37B) [14]. No terminal growth — the LNG and data-center demand upside is set aside.
- Shares 615.7M [15].
This calibrates almost exactly to the tape: $3.3B ÷ 0.10 = $33.0B, against a current market cap of $32.8B. In plain terms, the market is already capitalizing EQT at roughly $3.3B of perpetual cash flow with zero growth credit. At the peak ($41.8B) it was capitalizing about $4.18B — so the drawdown is the market lowering its estimate of perpetual cash flow by about $0.90B per year.
Scenario T — temporary. The low-price window depresses FCF for a few years, then reverts. Take three years at a punitive $1.0B/year shortfall (Q2-2026 annualized to ~$1.3B of FCF against ~$3.3B normalized; full-year 2026 consensus is barely below normalized because H1 was strong, so $1.0B for three years overstates the dip). PV of damage = 1.0/1.10 + 1.0/1.21 + 1.0/1.331 = $2.5B.
Scenario P — permanent. A level step-down in steady-state FCF, capitalized as a perpetuity. Two anchors bracket it. Low: the FY2027 EPS cut of $0.62/sh (90-day) on 615.7M shares is −$0.38B/year → $3.8B. High: capitalize the full $0.90B/year reduction the tape now implies → $9.0B. Range $3.8B–$9.0B, midpoint ~$6.4B.
Probability-weighted. At the trial's p_temporary = 0.71: expected damage = 0.71 × $2.5B + 0.29 × $6.4B = $3.6B (range $2.9–4.4B across the permanent anchors).
Source: DCF-lite derived from consensus FCF and the trial's p_temporary; discount rate 10%, no terminal growth. Permanent range $3.8B–$9.0B; midpoint shown [16].
The gap. Price damage of $9.0B (peak-to-current) against probability-weighted NPV damage of ~$3.6B leaves a gap of about $5.4B — roughly 60% of the drawdown, and about 16% of the current $32.8B market cap. The gap is real and material.
Its size, though, is entirely a function of the diagnosis. If the hit is purely temporary, NPV damage is ~$2.5B and the price overshot by ~$6.5B — it fell about 3.6× the value actually lost. If it is purely permanent at the high anchor, NPV damage is ~$9.0B and the gap closes to zero: the price move would simply equal the value move. A "no-mispricing" outcome is a live reading, not a rhetorical concession — it is what the 29% permanent tail buys.
The gap between price damage (~$9.0B) and plausible, probability-weighted NPV damage (~$3.6B) is about $5.4B, or ~16% of market cap — but it exists only to the extent the trial's 0.71 temporary reading holds. At the permanent high anchor the gap disappears.
The trial
The temporary-versus-permanent question was argued by two opposing corpus-cited briefs and ruled on by three independent judges. The ruling: the probability the impairment is temporary is 0.71, with a per-judge range of 0.56 to 0.72 and a mean of 0.66; the tally records the result as not contested, with an order-stability gap of 0.07 between reading sequences. The diagnosis this report carries is that number — it is not mine to override, and my arithmetic only frames what it is worth.
Source: trial tally, per-judge decisions (p_temporary 0.71; mean 0.66; spread 0.16; not contested).
The temporary case at its strongest. The adverse input is a mean-reverting commodity price, not an asset write-down. EQT generated "$330 million of free cash flow attributable to EQT in Q2 despite natural gas prices averaging just $2.89 per MMBtu," which it frames as proof of "our advantaged position at the low end of the cost curve" [17]. Through the drawdown the balance sheet strengthened, not weakened: "We exited the quarter with net debt of just under $5.7 billion… with Fitch upgrading EQT to BBB during the quarter" — a credit upgrade into a price trough, the opposite of a franchise impairment [18]. And forward earning power rose rather than fell — consensus FCF climbs to $3.83B by 2028 while management raised volume guidance [19][20].
The permanent case at its strongest. The shareholder's unit of ownership shrank permanently, independent of gas price. Diluted shares rose from 260.6M in FY2020 to 615.7M in FY2025 — a 136% increase, a 5-year CAGR of 18.8% — issued for the Tug Hill/XcL, Equitrans, and Olympus acquisitions, with no repurchases in 2024 or 2025 [21][22]. The dilution did not buy proportional reserves: total proved reserves rose only from 27,597 Bcfe (FY2023) to 28,046 Bcfe (FY2025), so proved reserves per diluted share fell from about 66.8 to 45.6 Mcfe/share — a 32% decline in the resource each share owns [23][24]. Even if gas recovers, each share owns less proved resource and must fund more midstream infrastructure — MVP firm capacity runs "through June 30, 2044," and Q2-2026 added LNG vessel leases of about $590M undiscounted.
Source: proved reserves 27,597 Bcfe (FY2023) and 28,046 Bcfe (FY2025) over diluted shares of 413.2M and 615.7M [25][26][27].
The two cases do not actually contradict on the facts — they disagree on which fact governs. Corporate free cash flow can be healthy (temporary) while per-share resource ownership is permanently lower (permanent); the market cap already embeds the 615.7M-share base, so the dilution explains why the level is lower, not, on its own, why the drawdown is permanent. The judges weighed both and landed at 0.71 temporary — closer to the cyclical reading, but with a live 0.29 tail that the arithmetic above cashes as the difference between a $5.4B mispricing and none.
Which line broke, and whether it self-corrects
For a single-segment Appalachian producer there is essentially one revenue driver, and it is the one that moved: the realized natural-gas price. Q2-2026's $2.89/MMBtu is the proximate cause of both the earnings dip and the estimate cuts [28][29]. The repricing mechanism on the temporary side is the demand calendar management points to — power, LNG, and data-center pull tightening the market into 2028–2029 — which, if it converts to firm contracts, lifts realized price and basis without EQT changing its cost structure.
The mechanism on the permanent side is different in kind and does not self-correct with price: share count and fixed infrastructure obligations. Dilution is not reversed by higher gas; it is reversed only by retiring shares, and there were none in 2024–2025 [30]. The clean test between the two, from the trial's flip conditions, is observable and near: whether the FY2026–27 10-K books a property impairment or negative proved-reserve/PUD revision (a real asset-base cut) rather than just a current-year price mark, and whether FY2026–27 realized FCF lands near the ~$3.1B consensus or keeps getting cut. The first would move the diagnosis toward permanent and close the gap; the second, toward temporary and widen it.
Yield
The framework prices this on adjusted free cash flow — reported FCF less stock-based compensation less a five-year average of acquisition spend — against a balance-sheet-selected reference line. EQT's FY2025 adjusted FCF works out to roughly $1.83 billion, a 5.6% yield on today's $32.8 billion market cap; the three-year average is 1.6%. Net debt near 1.3x EBITDA puts it on the 10% default line, so FY2025 sits about 440 basis points short, and the trailing average far more. The deterministic feature could not compute this — the workings below are rebuilt from the filed cash-flow statements.
The adjustment, line by line
The profile's fit_features.adjusted_fcf returned not_computable: the structured cash-flow feed carried no stock-based-compensation field for any year, so the derivation had no SBC to subtract. The components exist in the filed 10-Ks, so the table below reconstructs the adjustment directly from the consolidated statements of cash flows. Every reported-FCF and add-back figure is anchored to a filing page; the adjusted-FCF column is a computation, captioned as such.
Adjusted FCF = reported FCF − SBC − trailing five-fiscal-year average of cash paid for acquisitions; derived from company filings. Reported FCF and add-backs from the consolidated statements of cash flows: FY2025 10-K [1]; FY2022 10-K [2]; FY2021 10-K [3]. Adjusted-FCF column derived from fit_features inputs.
Two features stand out. SBC is small — $61 million in FY2025 against $2.84 billion of reported FCF [4] — so the SBC dock barely moves the number; the FY2024 spike to $158 million reflects merger-related vesting [5]. The acquisition dock does the work. Cash paid for acquisitions has been lumpy and large — $2.27 billion (FY2023, Tug Hill and XcL), $0.87 billion (FY2024), $0.48 billion (FY2025, Olympus) [6] — so the trailing five-year average holds near $0.94 billion a year. Subtracting it turns FY2024 adjusted FCF negative (roughly −$570 million) and cuts FY2025 from $2.84 billion reported to about $1.83 billion.
The acquisition dock understates EQT's true M&A intensity, because its largest deals were stock-funded and never touched the cash-acquisition line. Olympus (July 2025) cost about $1.94 billion — but only about $473 million in cash; the other roughly $1.47 billion was 25.2 million EQT shares. The framework's cash-based dock captured only the smaller slice.
The Olympus consideration — 25,229,166 shares worth about $1,471 million plus roughly $473 million cash — is set out in the FY2025 10-K [7]. It is one instance of a pattern: shares outstanding rose from 167 million (FY2016) to 616 million (FY2025), a five-year share-count CAGR near 18.8% (fit_features.share_count_trend), as Alta, Tug Hill, Equitrans and Olympus were funded substantially in equity. A yield basis built on cash acquisitions therefore flatters a company that has bought growth largely with stock — a point the Durability and Self-Help tabs carry further.
The yield, three ways
FY2025 Reported FCF Yield
FY2025 Adjusted FCF Yield
3-Year Avg Adjusted Yield
Yields on the $32.8 billion market cap ($53.29 close, 31 Jul 2026; 615.7M shares, per fit_features.market_cap). Adjusted FCF derived from filings [8]; market cap from the data feed.
On the reported number the yield is 8.6%. Docking SBC and the acquisition average brings the current-year figure to 5.6% ($1,834M / $32,812M). The through-cycle picture is weaker: averaging the three computable adjusted years — FY2023 $300M, FY2024 −$570M, FY2025 $1,834M — gives about $521 million, a 1.6% yield. FY2025's 5.6% is an above-trend year, not a settled level.
On the profile's jump test (fit_features.yield_baseline, also not_computable for want of a historical adjusted-FCF series), the qualitative read runs the other way from the fortress signature. This is not a stable low-single-digit name that has suddenly repriced to 8–9%; reported FCF has swung from −$23 million (FY2018) to $2.84 billion (FY2025), and the current adjusted yield sits above its own three-year average, not far above a formerly steady baseline. The volatility is the baseline.
Which bar applies
The reference line is set by the balance-sheet class. fit_features.balance_sheet_class returned unknown because EBITDA was missing from the FY2025 feed, but both inputs are in the filings.
Net Debt ($B)
FY2025 EBITDA ($B)
Net Debt / EBITDA
Net debt from fit_features ($7.69B = $7,293M long-term debt + $507M current maturities − $111M cash), anchored to the FY2025 balance sheet [9] and debt note [10]. EBITDA = operating income $3,250M + DD&A $2,600M, from the FY2025 statements of operations [11] and cash flows [12].
FY2025 EBITDA is operating income of $3.25 billion [13] plus DD&A of $2.60 billion [14], or $5.85 billion — close to the $5.9 billion figure the sell side reports. Against $7.69 billion of net debt that is 1.31x. Under the profile's rule (fortress at 0.5x or below, levered at 3.0x or above), 1.31x is the moderate band, which selects the 10% default line rather than the softer 8–9% fortress line.
Against that line the arithmetic is plain: 5.6% on FY2025 adjusted FCF is about 440 basis points short of the 10% bar; the 1.6% three-year average is about 840 basis points short. The name does not sit on the fortress line where an 8–9% yield would clear.
Normalized mid-cycle yield
EQT is a commodity cyclical, so a single year misleads and the normalization matters. FY2024 was a trough — Henry Hub averaged near multi-year lows and reported FCF fell to $573 million; FY2025 rebounded to $2.84 billion on firmer prices and the first full year of Equitrans midstream cost capture; FY2022's $2.07 billion rode the post-invasion gas spike. The swing is wide enough that the mid-cycle figure is a judgment, not a reading.
The workings, stated so they can be recomputed under other assumptions:
Trailing anchor. Three-year reported FCF (FY2023–FY2025) averages $1.52 billion — but two of those years predate the full Equitrans cost structure and the current LNG-driven demand pull.
Forward anchor. Consensus organic FCF (FY2026–FY2029) averages about $3.37 billion, on a higher post-integration production base (about 2.4–2.6 Tcfe) and lower midstream unit cost.
Mid-cycle assumption. Splitting toward the post-Equitrans structure — Henry Hub roughly $3.50–4.00/MMBtu, capex about $2.3–2.8 billion, no new large cash acquisition — puts mid-cycle reported FCF near $2.7 billion, an ~8.2% reported yield. Docking SBC (~$60M) and a normalizing acquisition average (~$0.5B as the 2021–2024 wave ages out) leaves mid-cycle adjusted FCF near $2.1 billion, about 6.5%.
So a fair mid-cycle adjusted yield lands around 6–7% — well above the depressed 1.6% trailing average, still 300–350 basis points inside the 10% line. A skeptic who assumes a $3.00 gas deck or continued cash M&A gets a lower number; one who trusts the full consensus plateau and no acquisition dock gets close to the bar. The sensitivity is mostly to the gas price and to whether the roll-up spending stops.
The consensus check
Consensus forward free cash flow (S&P Capital IQ, fit_features.consensus_forward_yield, vintage August 2026) is the reported-FCF proxy — the vendor does not publish an SBC-and-acquisition-adjusted series, so the chart shows consensus reported FCF and, alongside it, that same stream carried onto the framework's adjusted basis (less ~$60M SBC and the trailing acquisition average, which assumes no new cash M&A).
Reported-yield line from fit_features.consensus_forward_yield (S&P Capital IQ mean FCF ÷ current market cap): FY2026 9.5%, FY2027 9.6%, FY2028 11.7%, FY2029 10.3%. Adjusted-yield line derived by applying the framework's SBC and trailing-5-yr-acquisition docks to the same consensus FCF; the 10% line is the framework reference. Source: consensus data feed, as reported.
On the reported basis, consensus already clears the 10% line by FY2028 (11.7%) and holds it in FY2029 (10.3%) — the sell side sees the FCF the fear is discounting. On the framework's adjusted basis the crossing is later: FY2026 and FY2027 sit near 7.1–7.2%, and the yield reaches the bar only around FY2028 (about 10.7%), as the 2021–2024 acquisition wave rolls out of the trailing average.
That is the mean-reversion path, and its probability is conditional. The mechanism is real and largely mechanical — the acquisition dock shrinks each year unless refilled, and post-Equitrans volumes plus LNG demand lift organic FCF. The condition is that EQT stops making large cash acquisitions; it has not obviously stopped (Olympus closed July 2025, and it exercised the MVP buy-out right in January 2026 [15]). Weighing a supportive gas-demand setup against a live acquisition habit and gas-price risk, the adjusted yield clearing 10% and holding it within one to three years is more likely than not but not high-confidence — call it roughly 55–60%. What consensus would have to concede for the base case to hold is simply the FCF it already forecasts; what it does not model, and what would defer the crossing, is the next cash-funded deal.
FCF conversion trend
GAAP revenue is distorted by mark-to-market derivative gains and losses, so FCF-to-revenue is noisy here — on total operating revenues it runs 16.8% (FY2023, $6.91B), 10.9% (FY2024, $5.27B) and 32.8% (FY2025, $8.64B) [16]. The cleaner read is FCF as a share of operating cash flow, which strips the hedge noise.
FCF ÷ operating cash flow, from the consolidated statements of cash flows, FY2020–FY2025 [17] [18].
Conversion is not trending in a clean line — it tracks the capex cadence and gas price, dropping to 20% in the FY2024 investment trough and rebounding to 55% in FY2025. There is no steady deterioration that would undercut the forward case, but there is no compounding improvement either; the series is cyclical rather than directional, consistent with the volatility that keeps the through-cycle yield below the bar.
Durability
The year-10 gate is binary: will 2036 revenue and adjusted free cash flow both stand higher than today, with very high conviction. Volume durability is real — 28.0 Tcfe of reserves, roughly 30 years of drilling inventory, production climbing 2,016 → 2,382 Bcfe. But EQT is a price-taker whose revenue is "market-based" and, in its own words, unpredictable; adjusted FCF cannot be computed from the feed. Volume conviction is high; price conviction is not.
The conviction sources, graded for EQT
Ruchir's year-10 conviction comes from five places. For a commodity producer, they do not grade evenly.
Market structure — does not apply as a moat. EQT describes itself as "the only large-scale, integrated natural gas producer in the United States" [1], a claim carefully hedged with "integrated," because the unhedged title is contested: Expand Energy opens its own 10-K calling itself "the largest independent natural gas producer in the U.S., based on net daily production" [2]. This is not a monopoly, duopoly, or oligopoly. Gas is a commodity, and EQT states plainly that "we typically receive market-based pricing for our produced natural gas" [3]. There is no pricing power to defend share stability. This is the pillar the framework leans on most for tech and financial monopolies, and it is the one EQT lacks (see Business for the structure in full).
Regulatory entry barriers — weak as a moat, real as a cost. Nothing stops a new operator from drilling; the regulatory friction sits in permitting and pipelines, which is a constraint on EQT as much as a wall around it — the Mountain Valley Pipeline took years and repeated legal challenge to complete. Existing takeaway has scarcity value, but this is not the bank/insurer regime that keeps garage startups out.
Capital intensity as a moat — applies; the strongest source. This is the framework's "capital-heavy essentials survive the AI world" category, and EQT fits it. Reserves stand at 28,046 Bcfe with 93% in the Marcellus [4], atop roughly 2.3 million gross acres and 2,945 miles of pipeline [5]. The company estimates an undeveloped inventory of "approximately 4,000 gross locations" providing "more than 30 years of drilling inventory" at the current pace [6]. Replacing that asset base would cost tens of billions and a decade. As a low-cost producer with owned midstream, EQT's survival through a low-price world is well-protected.
Essential product — applies. Natural gas heats homes and runs baseload power; demand is resilient through recessions and, for now, growing (below). EQT reached its net-zero Scope 1 and 2 emissions target in 2025 [7], which matters to the "does this product get regulated out" question over a decade.
Long operating history — applies. EQT's lineage traces to 1888 [8]; it has survived more than a century of commodity cycles, including the 2019–2020 gas-price collapse.
Capital intensity and inventory — the durable half
Volume, not price, is where EQT's durability is genuinely underwritable. Sales volumes have grown three years running, and the reserve life is measured in decades.
Source: FY2025 Annual Report (Form 10-K), Upstream Sales volume table [9].
The strategy is explicitly built to "generate durable free cash flow across commodity price cycles," resting on the inventory, the midstream, and a low-cost position [10]. The July 2024 Equitrans integration is the mechanism: by owning gathering and transmission, EQT converts a third-party cost into an intercompany one and lowers its breakeven — the source of the "durable FCF" claim. On volume and cost, a higher-in-ten-years case is credible.
Essentialness and the demand thesis
The bull leg of the gate is that gas demand is structurally rising, so EQT's growing volume clears into a bigger market. EQT's own deck frames data-center and power load as "the cornerstone to natural gas bull case" [11], and the MVP Boost expansion was oversubscribed enough to be upsized 20% on utility demand tied to Northern Virginia data-center alley and Southeast coal retirements [12]. On the LNG side, management notes the US is on track to exit 2025 with "over 4 Bcf per day of incremental LNG demand," the largest annual increase since exports began, and expects non-US gas demand to rise "by 200 Bcf per day between now and 2050" [13].
The honest texture: EQT's own domestic gas-power demand chart shows the base 2030 case at roughly 36 Bcf/d against ~37 Bcf/d in 2025 — nearly flat, with the load-growth story landing more in gigawatts than in near-term gas burn [14]. The demand case rests heavily on LNG exports, which are themselves a policy- and infrastructure-dependent bet on a ten-year horizon.
The structural threats, hunted
Commodity price — the threat that dominates. Revenue is volume times a price EQT does not set and says it cannot forecast: "our revenues, earnings and liquidity are substantially dependent on the prices we receive… we are unable to predict future potential movements in the market prices" [15]. In 2025 alone, Henry Hub ranged from $2.65 to $9.86 per MMBtu [16], and Appalachian gas prints "typically lower relative to NYMEX Henry Hub" on regional oversupply and limited takeaway [17]. A 10% move in NYMEX shifts derivative fair value by roughly $100 million [18]. This is not execution risk, which is not a moat anyway; it is the structural fact that the revenue leg of the year-10 gate is a commodity forecast.
Substitution / energy transition. EQT states that gas "competes with other forms of energy… including coal, liquid fuels and, increasingly, renewable and alternative energy" [19], and that climate developments "may expedite a transition away from the use of carbon-intensive sources" [20]. Year 2036 sits inside the window where renewables build-out and policy could bend domestic gas-power demand — the same window the bull thesis needs to be rising. The "your margin is my opportunity" question points not at a cheaper gas producer but at substitution: the disruptor to gas demand is electrons, not a lower-cost driller.
Depletion. Production "generally declines as reserves are depleted," so revenue and reserves fall "without continued successful development or acquisition" [21]. The 30-year inventory answers this — but only through continuous capex, which is execution, not a moat.
The disqualifier check (X3)
The framework's one hard structural-decline test is revenue declining high-single-digit for three consecutive years. On fit_features.revenue_trajectory, three_year_hsd_decline is false and consecutive_decline_years is 1 — the disqualifier does not fire. The reason is the opposite of stability: revenue whipsaws violently in both directions.
Source: derived from fit_features.revenue_trajectory (reported total revenues, which include commodity and derivative effects); FY2024–FY2025 revenue is null in the data feed and excluded.
Revenue fell 58% in 2023 after nearly tripling into 2022 — a price cycle, not a slow structural bleed. Volume, meanwhile, kept rising. So structural decline is checked-and-absent: EQT is cyclically volatile, not secularly shrinking. The caveat is real — the feature series ends at FY2023 because the feed carries no revenue line for FY2024–FY2025 — but the volume record and the reserve life both point the same way, away from structural decline.
FCF consistency (P2)
The framework wants the rolling five-year adjusted-FCF average to be stable and predictable. Here it cannot be computed: fit_features.adjusted_fcf and fit_features.fcf_stability both return not_computable because stock-based compensation is missing for every year (2016–2025) in the feed, so the adjusted figure and its stability metric have no basis. That is itself a finding for a P2 that is verdict-critical.
What the reported cash flow shows is genuine unpredictability, not the "volatile-but-averages-out" pattern the framework tolerates.
Source: reported FCF from data/financials/cash_flow.json (operating cash flow less capex); this is reported FCF, not the framework's adjusted figure, which is not_computable — SBC absent for all years.
Reported FCF swung from –$23M in 2018 (a peak-capex growth year, $3.0B spent) to a record $2.84B in 2025 — a range the word "very high conviction" does not survive. The reported rolling five-year average does rise (roughly $184M to $1.45B), but that reflects scale bought with equity — share count roughly quadrupled from 167M to 616M over the decade (see Self-Help) — and higher gas prices, not a predictable annuity. The one negative year is capex-driven, not the healthy 5–8-year underwriting loss the framework prizes in insurers and banks; there is no such counter-cyclical mechanism here. This cuts against P2.
The year-10 case, both ways
The strongest case that both are higher. Production is already rising, the reserve life is 30-plus years, MVP Boost is oversubscribed [22], and 4.5 MTPA of LNG offtake is signed for 2030–2031 [23]. Integrated midstream lowers the breakeven, so FCF is defended even in a soft-price world; 2025 FCF was a record. If gas prices merely hold near the mid-cycle, both revenue and FCF are higher in 2036 with room to spare.
The strongest doubt. Revenue equals volume times a price EQT explicitly says it cannot predict [24]. A 2036 that looks like 2020 (revenue $2.65B) or 2023 (down 58% in a year) is entirely available, because nothing in EQT's control sets the price, and the energy transition is a genuine tail on demand. Adjusted FCF — the framework's actual FCF measure — cannot be computed at all here.
The read, once. On volume and low-cost survival, EQT's durability is real. On the gate as the framework defines it — very high conviction that both revenue and adjusted FCF are higher in ten years — there is a genuine doubt, and its name is realized price: a global-and-regional commodity EQT neither controls nor claims to forecast. Under the framework's binary construction, that doubt means the year-10 gate does not clear with very high conviction. What would change the read is durable evidence that structural LNG-and-power demand has put a firm floor under Appalachian realized prices through a full cycle — a floor that does not yet exist in the record.
Self-Help
EQT can comfortably outlast a gas-price downturn: investment-grade credit, a laddered senior-note schedule with no single-year wall, a $3.5 billion undrawn revolver, and net debt cut to roughly $5.7 billion against a $5.0 billion target. But the repurchase engine runs in reverse. Shares outstanding nearly quadrupled — from 167 million in 2016 to 616 million in 2025 — on serial all-stock acquisitions, while executed buybacks totaled just $622 million since 2021 and were zero in both 2024 and 2025. On the framework's share-count test, EQT does not fit.
The balance sheet against the problem's duration
The near-term problem here is a gas-price soft spot, not a solvency question. EQT closed 2025 with net debt of about $7.7 billion, and by the first quarter of 2026 had driven it to roughly $5.7 billion — "on the doorstep" of the long-standing $5.0 billion target management repeats on essentially every call [1]. The company published a formal Debt Retirement Plan in 2024 (reduce debt to $7.5 billion by end-2025) and updated it in 2025 (a long-term goal of $5.0 billion), and it maintains investment-grade credit metrics [2].
The maturity ladder is the reason the balance sheet is not a constraint on capital allocation. As of December 31, 2025, EQT's senior notes mature roughly $508 million in 2026, $1,281 million in 2027, $545 million in 2028, $1,650 million in 2029, $1,169 million in 2030, and $2,343 million thereafter — about $7.5 billion in total, with no year demanding more than $1.65 billion [3].
Source: FY2025 Annual Report (Form 10-K), Note 7 — Debt [4].
Liquidity is deep. EQT holds a $3.5 billion revolving credit facility whose maturity was extended to July 2030, underwritten by a broad bank syndicate in which no single lender holds more than 10% of the commitment [5]. A consolidated $400 million Eureka facility sits alongside it [6]. In April 2025 EQT exchanged roughly $3.9 billion of legacy Equitrans (EQM) notes for new EQT notes at consistent maturities and covenants, folding the acquired debt into its own investment-grade stack [7].
Net Debt, FY2025 ($M)
Senior Notes Total ($M)
Undrawn Revolver ($M)
Cash, FY2025 ($M)
Sources: net debt derived from FY2025 balance sheet (long-term debt $7,293M + current portion $507M − cash $111M); senior-note total and revolver per Note 7 [8] [9].
Bottom line on P4a: EQT can outlast the problem without capital allocation being forced toward debt. The maturity wall is spread, the revolver is untapped, and free cash flow of $2.8 billion in FY2025 covers the schedule several times over. The one framework caution belongs to the allocation question, not the capacity question — and it points the other way. Through 2024 and 2025, EQT directed capital squarely at deleveraging (long-term debt fell from $9.0 billion to $7.3 billion) and at $4.7 billion of asset sales, and repurchased no stock at all. That is precisely the pattern the framework flags: debt paydown became the priority through the depths of the cycle, exactly when repurchases would have compounded most.
The repurchase record — executed, not authorized
EQT carries a $2.0 billion share-repurchase authorization that runs to December 31, 2026. The record against it is thin. From the program's inception in 2021 through December 31, 2025, EQT purchased shares for an aggregate $622.1 million, leaving roughly $1.4 billion unused — and it "did not repurchase any equity securities during the years ended December 31, 2025 and 2024" [10]. The only year of real execution was 2023, when EQT bought 5,906,159 shares for $200.0 million at an average $33.86 per share — well below today's $53.29, so the price discipline was sound even as the scale was small [11].
Source: FY2025 Annual Report, Consolidated Statements of Cash Flows [12]; Note 18 — Equity [13].
Set the buyback line against the share count and the framework's verdict writes itself. Shares outstanding rose from 166.978 million in FY2016 to 615.717 million in FY2025 — a 3.7x increase, compounding at roughly 18.8% a year over the last five [14]. The driver is serial all-stock M&A: EQT issued 49,599,796 shares for Tug Hill and XcL (August 2023), 152,427,848 shares for the Equitrans Midstream merger valued at $5.5 billion (July 2024), and 25,229,166 shares for the Olympus Energy acquisition valued at about $1.5 billion (July 2025) — roughly 227 million new shares from those three deals alone [15].
Source: derived from reported financials and share-issuance disclosures, FY2016–FY2025 (fit_features.share_count_trend); Note 18 — Equity [16].
The framework's hard rule: companies whose share count keeps rising on stock-funded M&A do not fit, regardless of the buyback authorization. EQT's count nearly quadrupled over a decade while cumulative buybacks retired a fraction of one year's issuance. The $622 million bought since 2021 is dwarfed by the ~227 million shares issued for three acquisitions in the same window. On P4b, this is a framework fail.
The rising count is not an accounting artifact of stock-based compensation — EQT's dilution is deal-driven — but the conclusion the framework draws is the same either way: the flywheel that is supposed to convert a 10% yield into 10% of EPS growth has been running backwards.
Management's buyback intent, from the record
The intent is now genuinely there — it is the execution that is unproven. Buybacks were largely absent from prepared remarks in 2023 and mid-2024; they "emerged" as a capital-allocation pillar only once the balance sheet was derisked, and by 2026 management frames accumulating cash for aggressive repurchases as its next lever, even calling it its M&A strategy. On the Q1 2026 call the CFO said EQT intends to "accumulate cash, which we plan to aggressively deploy into share buybacks during the industry's episodic down cycles" [17]. Pressed by UBS on the same call about how much cash to hold for stock weakness, management said it was "not opposed to accumulating … up to a few billion dollars of cash," but with the stock near a 52-week low would "be countercyclical rather than procyclical" [18].
This is credible language backed by a derisked balance sheet, and it is the strongest fact for EQT on this tab. The counter-fact is that not a single dollar of it has been executed: buybacks have been zero for two years running while the shares fell, and management has instead just closed another stock-funded acquisition (Olympus). The framework rewards a demonstrated repurchase habit, not a stated one. Alongside, there is no supporting signal from insiders — the trailing Form 4 record shows grants, option exercises, and tax-withholding dispositions, but no open-market purchases.
The levered exception does not apply
The framework tolerates a rising-share-count, levered profile only when the yield is extreme — roughly 25%+ — and there is a demonstrated multi-year share-count reduction and FCF/revenue is not deteriorating. All three legs must hold. EQT clears none cleanly: consensus forward free-cash-flow yield runs about 9.5% for FY2026 and 11.7% for FY2028 on the current market cap — a normal-to-attractive yield, but nowhere near the 25% bar (the adjusted-yield computation and its bar sit on the Yield tab) — and the share-count leg fails outright, since the count is rising 3.7x rather than falling. This is not the Charter-style levered exception; it is the ordinary case the share-count rule excludes.
Consensus forward FCF yield derived from CapIQ estimates on the current $32.8B market cap (fit_features.consensus_forward_yield); share-count trend per Note 18 — Equity [19].
The absurdity check
The framework's absurdity check — how many years of adjusted free cash flow retire the entire float at today's price — cannot be computed on its own terms here, because adjusted FCF is not derivable (stock-based compensation is not broken out in the cash-flow feed, so FCF − SBC − 5-year-average acquisitions returns not_computable). On reported free cash flow the arithmetic is straightforward and undramatic: the $32.8 billion market cap divided by FY2025 reported FCF of $2.84 billion is about 11.6 years, and against consensus FY2026 FCF of $3.12 billion about 10.5 years. Far from the ~3-year figure that signals a price making a claim it cannot survive, this check does not trip for EQT — the market is not pricing the equity as if the whole float retires in a few years.
Dividend safety
The dividend is immaterial to the case: EQT declared a $0.165 quarterly dividend on February 5, 2026 — $0.66 annualized, a yield of about 1.2% at $53.29 — covered roughly 7x by FY2025 free cash flow, and not a pillar of the return [20].
Management credibility
The delivery record does not read as promotional. Of the material commitments that have resolved inside the call history, most were met or beaten: the $4.7 billion asset-sale and joint-venture program closed in Q4 2024, a year ahead of schedule; net debt fell from about $13.7 billion at the end of Q3 2024 to roughly $5.7 billion by Q1 2026; the Q4 2025 promise to "exit the first quarter with less than $6 billion of net debt" was kept at about $5.7 billion; and Equitrans compression synergies have repeatedly beaten management's own upside case. The one clear miss belongs to the same acquisitive habit that drives the share count: the Q4 2024 guidance to "exit 2025 with net debt of approximately $7 billion, comfortably below our target of $7.5 billion" landed instead near $7.7 billion, because management chose to fund the Olympus acquisition rather than hit the number.
Source: EQT quarterly earnings calls, Q3 2023–Q2 2026 (guidance ledger); net-debt figures cross-checked to the FY2025 balance sheet.
The calibration point against management is not the delivery record but two governance facts. First, the language has escalated with the balance sheet — "exponential value," then "the transformation of EQT is now complete" — with the first explicit near-term caution ("a very short-term soft spot") appearing only in Q2 2026. Second, insider economic ownership is thin: as of February 5, 2026, CEO Toby Rice held 2,454,427 shares plus 1,000,000 exercisable options, and all 17 directors and executive officers as a group held 4,510,816 shares — less than 1% of the class [21]. That combination — bullish, rising claims and sub-1% ownership — is what the framework's promotional-CEO exclusion is built to catch. It stops short of a clean exclusion hit here only because the delivery record holds and the CEO is a founder with a nine-figure dollar stake; but the low ownership alongside a share count that keeps climbing is a real caution, not a clean bill.
Clock
What would re-rate EQT is a natural-gas repricing cycle — Henry Hub prices, winter draws, and a structural Appalachian demand wave (LNG, power, data centers) that management dates to 2028–2031, not the next four quarters. The name's own history says a 28% drawdown like this one repairs in roughly 3 to 28 months depending on the gas cycle. The sell side is already positioned above the price, not capitulated. Long-dated listed options exist; 30-day implied volatility sits at 27.1%, below the elevated range.
The re-rating mechanism, and its calendar
EQT is a commodity cyclical, so the gap between today's $53.29 and the ~$67 analyst mean closes primarily on the price of natural gas, not on a company-specific guidance reset. The company sits at the low end of the cost curve — Q2 2026 generated $330 million of free cash flow even with benchmark gas averaging just $2.89/MMBtu [1] — which means the operating leverage to a higher strip is intact but its timing is set by weather, storage, and Permian associated-gas growth rather than by a dated event.
Underneath the commodity, a structural demand thesis is in motion, and it is the part with a nameable calendar:
Sources: Q2 FY2026 earnings call [2] [3]; earnings date per company calendar.
Management's own framing is that the structural inflection is a late-decade event. On the Q2 2026 call: "Looking into late 2027 and beyond, we see an inflection again … the structural case for gas into 2028 and 2029 — driven by power and LNG — looks increasingly strong" [4]. The demand set behind that view is large but unrisked: EQT counts "over 45 Appalachia demand and pipeline takeaway projects under construction or in evaluation totaling nearly 20 Bcf/d of potential demand" [5], against 18 Bcf/d of US LNG export capacity under construction or pending FID [6] and a projected 6–7 Bcf/d of in-basin demand growth by 2030 [7]. Management itself flagged that the market may lag: the commodity curve is "not really showing up in the futures markets yet," and price recognition arrives "when it becomes obvious."
A second, company-controlled mechanism is the buyback flywheel — but it is prospective, not yet running. EQT is "on the doorstep of achieving our long-term net debt target of $5 billion," after which cash on hand becomes "a strategic tool to fund aggressive share buybacks … during the industry's episodic down cycles" [8]. Asked directly about the stock near its 52-week low, the CFO said "where the stock price is right now, we would look to be more aggressive in buybacks" [9]. The denominator that would shrink has instead been rising — 615.7 million shares in FY2025 against 407 million in FY2022, an 18.8% five-year CAGR driven by the Equitrans and other stock-funded deals — so any per-share re-rating from buybacks starts only once the balance-sheet target is hit and the habit begins. The self-help mechanics are treated in full in Self-Help.
Base rates from EQT's own history
Gas producers swing far more than their intrinsic value does, and EQT is no exception. Restricting the sample to the post-2020 pure-play era — after the November 2018 Equitrans Midstream spin-off, which mechanically distorts any drawdown that straddles it — the name has run four drawdowns of ~28% or deeper. The recovery clock has ranged from roughly three months to more than two years, set entirely by how fast gas repriced.
Source: derived from EQT daily price history, 2020–2026 (company price data feed). Episodes measured as closing peak to closing trough from a running all-time-high.
Source: derived from EQT daily price history, 2020–2026 (company price data feed).
The arithmetic a skeptic can recompute: the 2022–23 episode fell from a $50.60 close (Sep 14, 2022) to $28.83 (Mar 15, 2023), a 43% drawdown that took about 28 months to reclaim its prior peak — a full gas-glut cycle. The June 2022 wobble, by contrast, fell 36% from $49.80 to $31.65 and was back within three months when the strip firmed. The current episode is the shallowest of the set: a 28% fall from the $67.93 all-time-high close (Mar 25, 2026) to $48.85 (Jul 10, 2026), 107 days peak-to-trough, and it has already bounced roughly 9% to the $53.29 close. Management fielded the drawdown directly, with an analyst on the Q2 call noting the stock had "gone back towards a 52-week low" [10]. The volume signature confirms the milder read: the drawdown carried a volume multiple of 0.98 against the pre-peak baseline — no capitulation spike — which the drawdown anatomy in Dislocation treats in full. The deeper historical shocks (a 69% fall in 2008, a 92% peak-to-trough over 2014–2020) belong to a different, pre-spin-off, more levered entity and are noted only as scale.
The 18-month test
Re-recognition within ~18–24 months is plausible but rests on the gas cycle, not on a dated catalyst inside the window. The near-term levers — the Q3 print on October 20, 2026, an additional demand deal by year-end, and the winter 2026-27 strip — can move the stock, but the largest of them (gas price) turns on weather and supply and cannot be dated. The structural demand wave that management leans on is explicitly a 2028–2031 story, outside the 18-month horizon, and management concedes the futures curve is not yet pricing it. The read: a bounce toward the analyst mean is a cyclical, gas-price-dependent expectation on this horizon; a durable structural re-rating is a multi-year one. What would falsify the near-term case — and it ties to the falsifier ledger — is the gas strip staying weak (a warm winter plus Permian associated-gas growth), with the buyback pivot deferred while the company keeps accumulating cash.
What consensus expects, and when
The sell side is not capitulated — the opposite of the Centene-style setup the framework hunts. Twenty-five analysts carry a mean target of $67.08 (25.9% above the $53.29 close) and a median of $67.00, with 20 of 25 at buy or strong-buy and none at sell.
Current Price
Mean Target
High Target
Low Target
Source: consensus analyst price targets, as of Aug 2, 2026 (25 analysts; 20 buy/strong-buy, 5 hold, 0 sell).
Where consensus expects the recovery to print is in the free-cash-flow line, and it steps up on the same 2028 calendar the demand deals follow. Consensus forward FCF yield on today's market cap runs 9.5% for FY2026, holds ~9.6% in FY2027, then jumps to 11.7% in FY2028 as the LNG and utility contracts begin contributing.
Source: consensus FCF estimates on current market cap, per fit_features.consensus_forward_yield (derived from CapIQ estimates).
The candidate quarter for the first printed confirmation is Q3 FY2026 (reported October 20, 2026), which will show the raised production guidance of roughly +90 Bcfe at the midpoint [11]; the FCF step-change consensus is really underwriting does not arrive in the numbers until FY2028. The yield computation against the framework's reference bars is carried in Yield; the durability of the demand thesis in Durability.
Instrument facts
These are stated as facts, not as suggestions. Long-dated listed options exist on EQT: it is an S&P 500 constituent with an actively traded options market, and LEAPS carrying January 2028 expiries have been listed since September 2025 — roughly 17 months of tenor as of this writing, within the framework's 12-month-plus (ideally 18-month) reference for expression.
30-day implied volatility
120-day implied volatility
Source: AlphaQuery option-statistics, EQT mean implied volatility, as of Jul 31, 2026.
The current 30-day mean implied volatility reads 27.1%, and the 120-day mean 29.2%, both as of July 31, 2026 — a mildly upward-sloping term structure that sits comfortably below the framework's reference lines (up to ~50–55 acceptable; 60–70 elevated). A precise current open-interest figure was not verifiable from a citable source; liquidity is characterized qualitatively as that of a large-cap ($32.8 billion market cap) S&P 500 name with continuously quoted LEAPS. No strikes, expiries, or structures are named or implied here, and implied volatility is reported from a dated source rather than estimated.