Annual Reports
EQT Corporation's annual reports contain management's most considered account of the business. These are the sections, passages and visual pages worth opening in the originals preserved in Sources.
EQT Corporation — FY2025 Annual Report (Form 10-K) — FY2025
EQT's first 10-K as a fully vertically integrated gas company post-Equitrans — three-segment structure plus the Olympus deal. · Open the full document →
Item 1. Business — General and Strategy — p. 11 · Read the full section →
Management's own framing of the vertically integrated, low-cost model built to generate free cash flow across price cycles.
Vertically integrated across upstream, gathering and transmission; strategy to be the low-cost producer.
We are a vertically integrated natural gas company with upstream, gathering and transmission operations focused in the Appalachian Basin. As of December 31, 2025, we had 28.0 Tcfe of proved natural gas, NGLs and oil reserves across approximately 2.3 million gross acres and approximately 2,945 miles of pipeline infrastructure. […] Our core business strategy is to be the leading low-cost producer of natural gas with a business model designed to generate durable free cash flow across commodity price cycles. […] As the only large-scale, integrated natural gas producer in the United States, we believe we are well positioned to excel during times of market volatility and to serve growing sources of demand, including power generation, industrial consumption, domestic data center development and LNG exports.
p. 11 · Read in context →
Upstream Segment — Reserves — p. 15 · Read the full section →
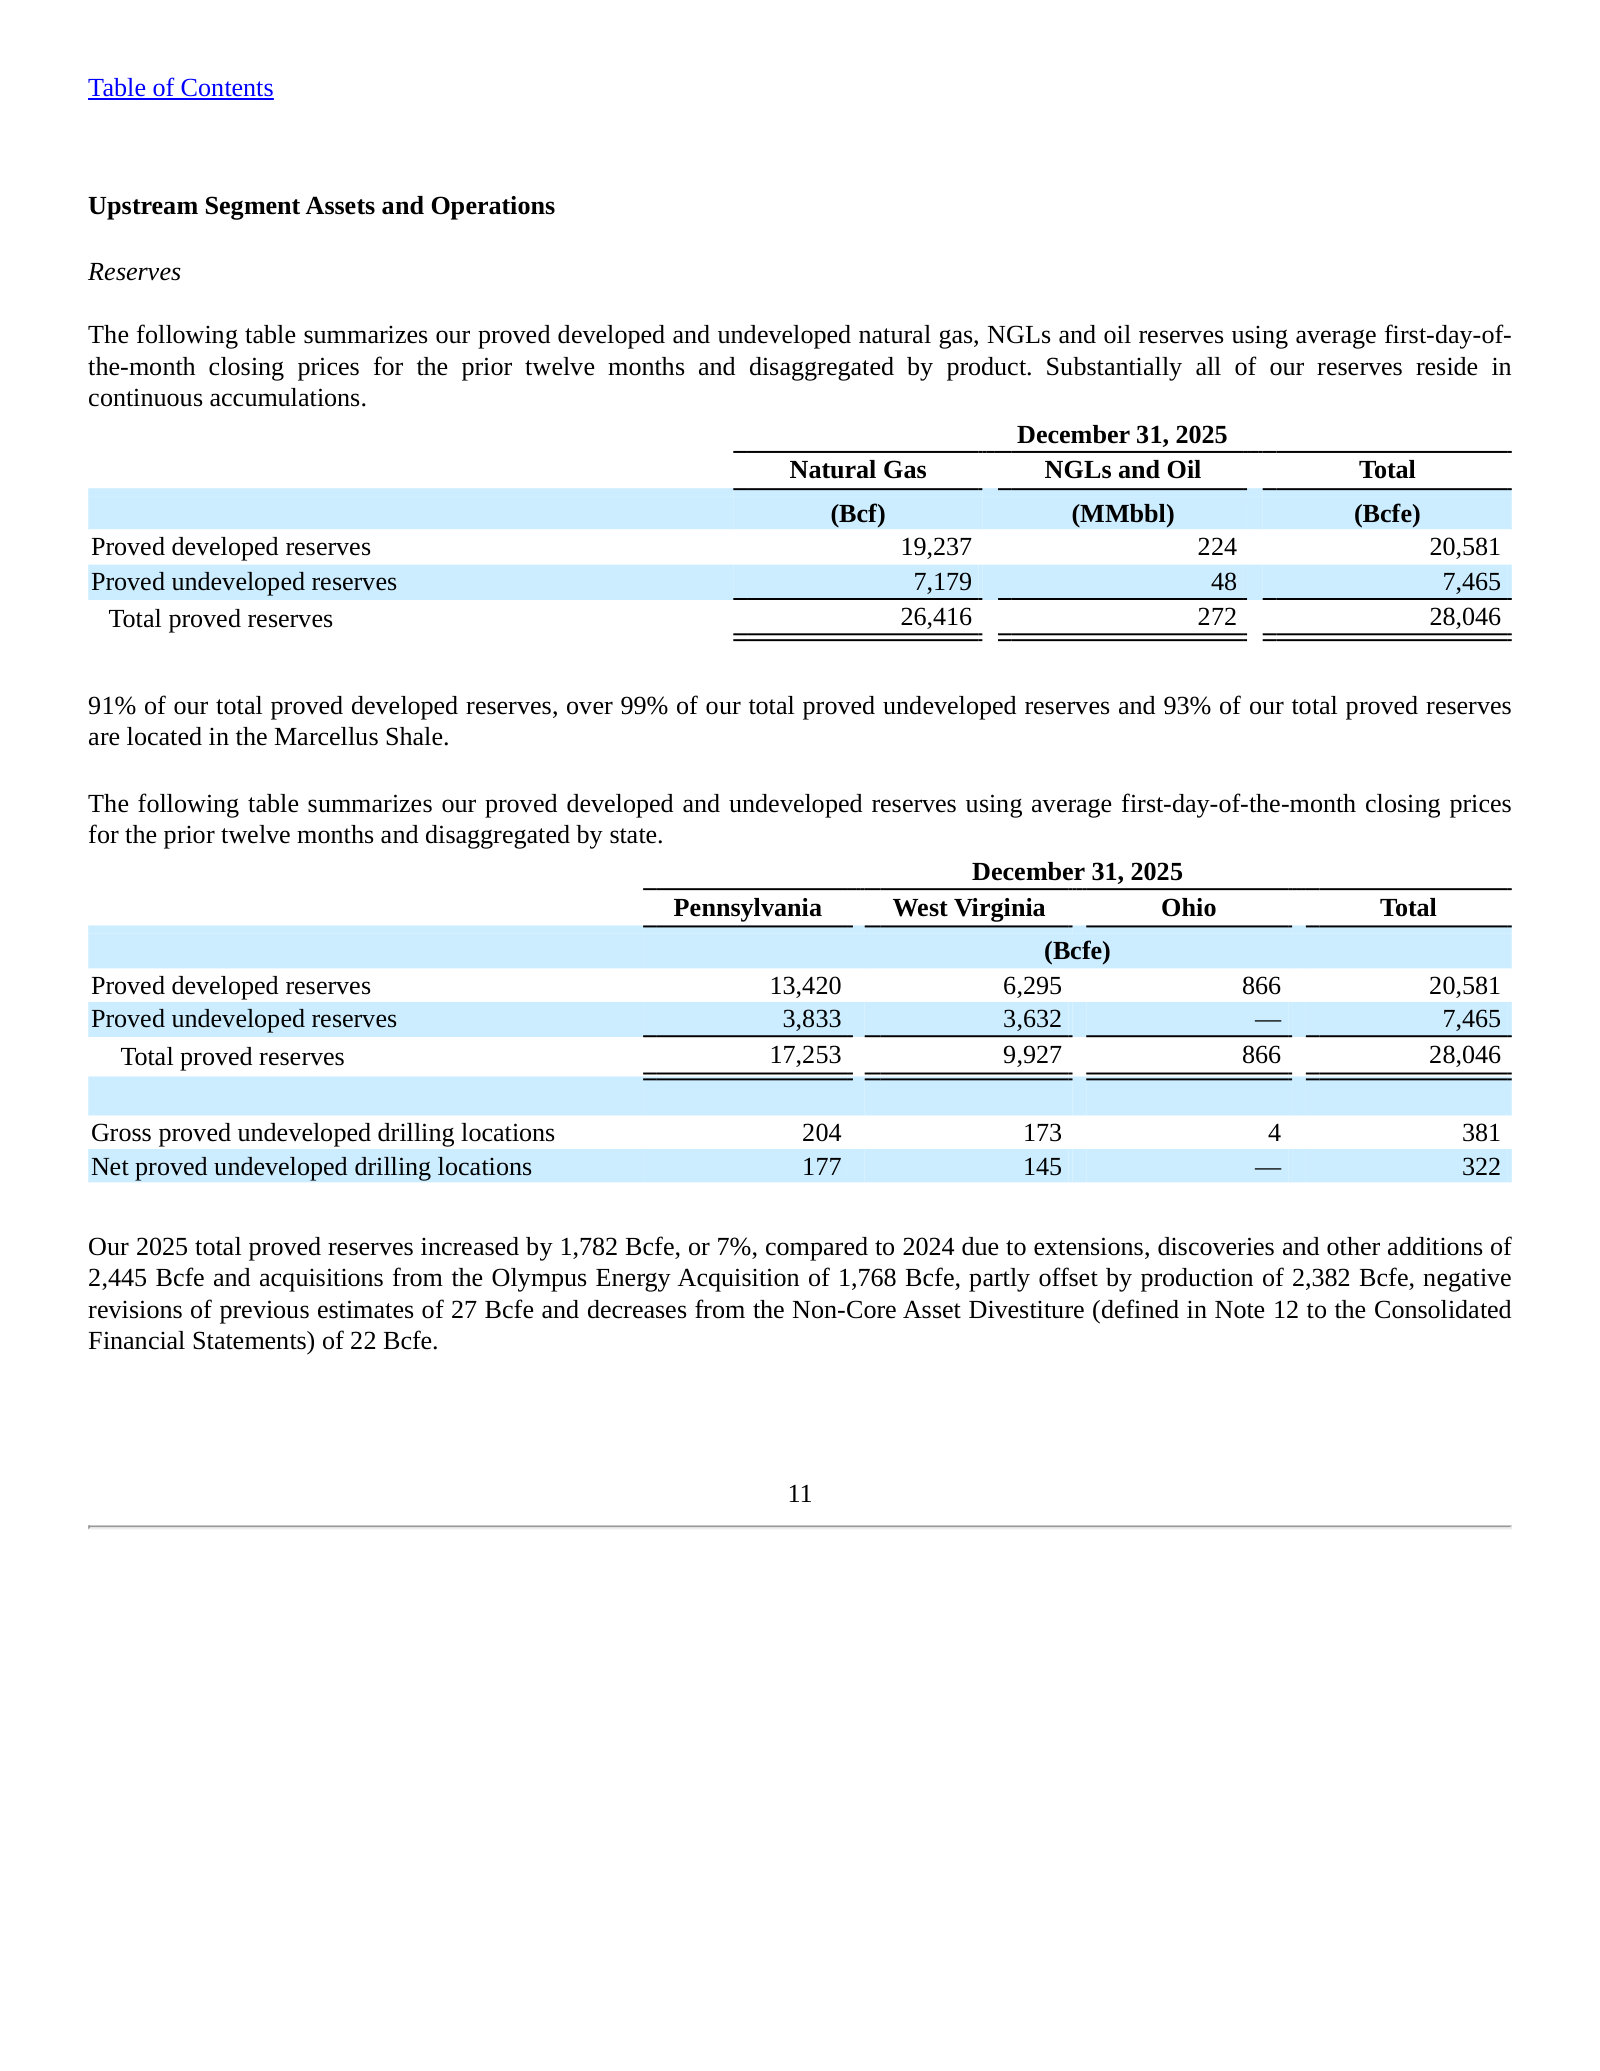
The asset base in one table: 28.0 Tcfe of proved reserves, 93% in the Marcellus, by product and by state.
Gathering and Transmission Segment Assets and Operations — p. 23 · Read the full section →
Shows the integration economics: most midstream throughput and revenue now comes from EQT's own upstream volumes.
Roughly three-quarters of gathering throughput and revenue is captive Upstream volume.
Our Gathering segment has gathering agreements with our Upstream segment and with third parties. […] For the year ended December 31, 2025, our Upstream segment accounted for approximately 73% of our gathering system throughput and approximately 76% of our Gathering segment's operating revenues.
p. 23 · Read in context →
Item 1A. Risk Factors — p. 47 · Read the full section →
The two risks most specific to EQT: near-total exposure to volatile gas prices and a $7.8B debt load near investment-grade's edge.
~93% of proved developed reserves are gas; Henry Hub ranged $2.65–$9.86/MMBtu in 2025.
Because our production and reserves predominantly consist of natural gas (approximately 93% of our equivalent proved developed reserves as of December 31, 2025), changes in natural gas prices have a significantly greater impact on our financial results than oil prices. […] The daily spot prices for NYMEX Henry Hub natural gas ranged from a high of $9.86 per MMBtu to a low of $2.65 per MMBtu between the period from January 1, 2025 through December 31, 2025, and the daily spot prices for NYMEX WTI oil ranged from a high of $80.73 per barrel to a low of $55.44 per barrel during the same period.
p. 57 · Read in context →
$7.8B of debt outstanding, with credit-rating downside if gas prices fall.
As of December 31, 2025, we had $7.8 billion of debt outstanding, and we may incur additional indebtedness in the future. […] In addition, our level of indebtedness may be viewed negatively by credit rating agencies and our credit ratings may be lowered.
p. 64 · Read in context →
Item 5. Market for Common Equity — Five-Year Total Return — p. 90 · Read the full section →
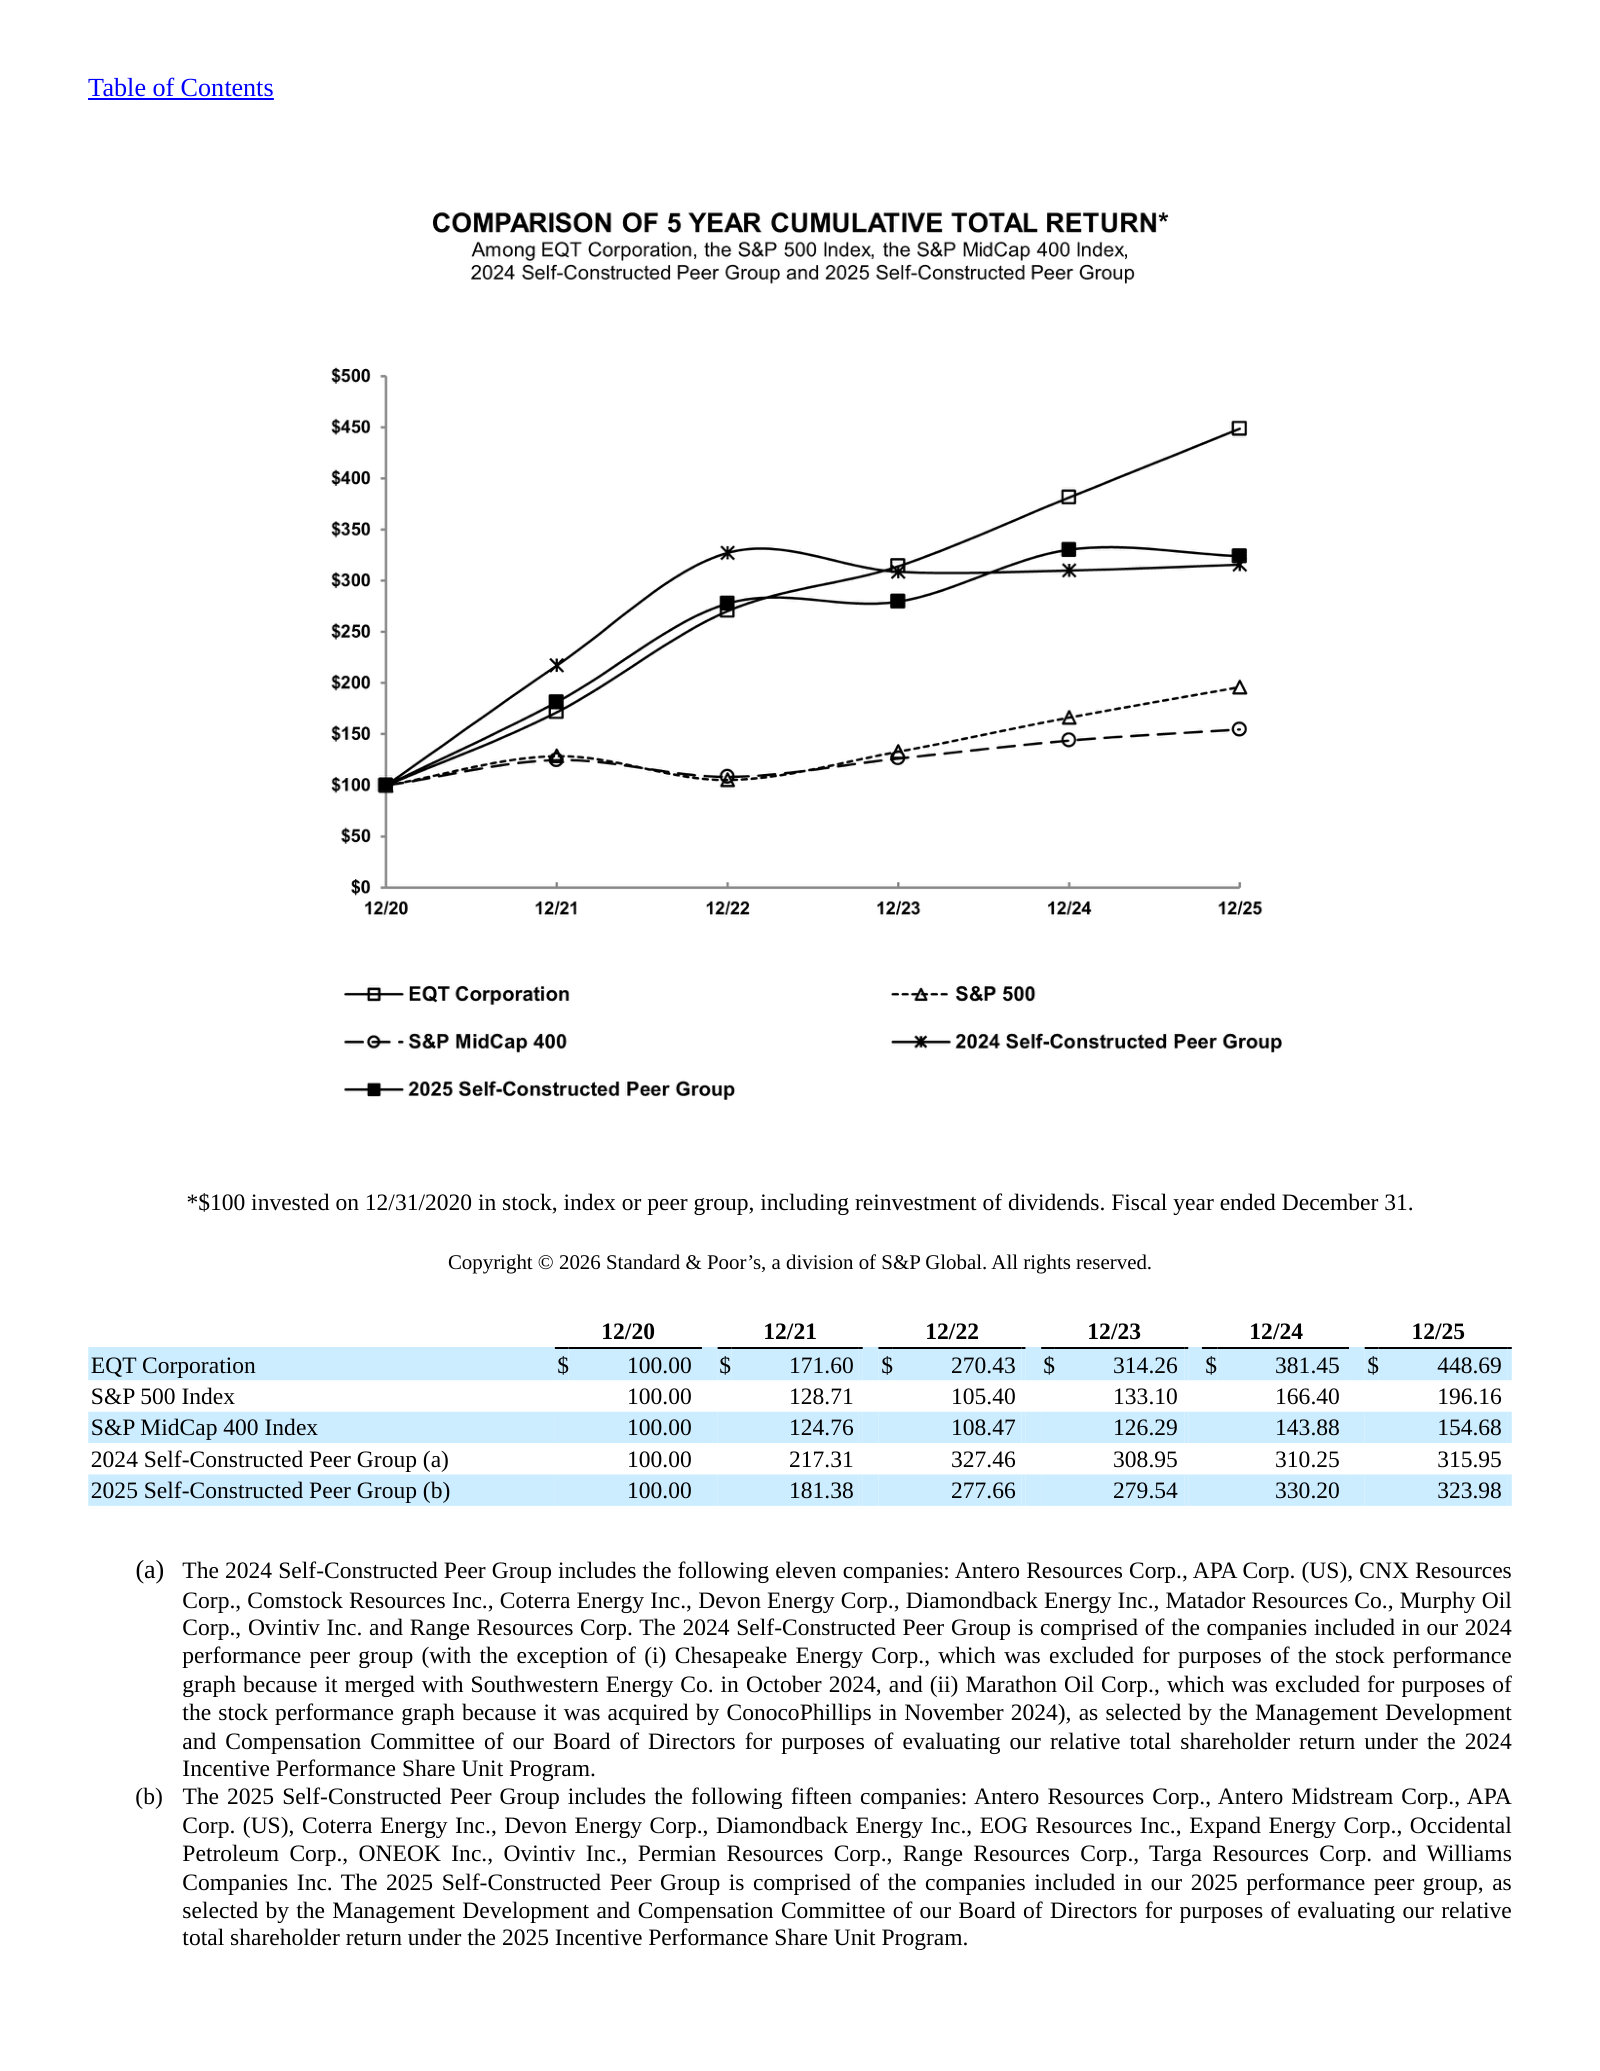
A $100 investment at end-2020 grew to ~$449 by end-2025, outrunning the S&P 500 and MidCap 400.
Item 7. Management's Discussion and Analysis — p. 92 · Read the full section →
Where management explains the year: the reshaping transactions and the swing in earnings they produced.
The 2024–25 reshaping: $3.5B Midstream JV sale and the Equitrans merger integration.
Our results of operation for 2025 reflect the impact of the Midstream Joint Venture Transaction (defined in Note 9 to the Consolidated Financial Statements), where we received $3.5 billion of cash consideration from a third-party investor in exchange for a noncontrolling equity interest in the Midstream Joint Venture. […] Beginning July 22, 2024, our results of operations reflect our operation of the assets acquired in the Equitrans Midstream Merger (defined in Note 11 to the Consolidated Financial Statements).
p. 92 · Read in context →
Net income jumped to $2,039M ($3.31/sh) from $231M ($0.45/sh), driven by higher realized gas prices.
Net income attributable to EQT Corporation for 2025 was $2,039 million, $3.31 per diluted share, compared to $231 million, $0.45 per diluted share, for 2024. The increase was driven predominantly by higher sales of natural gas, reflecting higher average realized natural gas prices.
p. 94 · Read in context →
Critical Accounting Estimates — Oil and Gas Reserves — p. 112 · Read the full section →
Reserve estimates set depletion rates and impairment tests — the estimate that most defines a producer's reported results.
How proved reserves are defined and why quantity revisions flow straight into the financials.
Proved oil and gas reserves, as defined by SEC Regulation S-X Rule 4-10, are those quantities of oil and gas that, by analysis of geoscience and engineering data, can be estimated with reasonable certainty to be economically producible from known reservoirs under existing economic conditions, operating methods and government regulations prior to the time at which contracts providing the right to operate expire unless evidence indicates that renewal is reasonably certain regardless of whether deterministic or probabilistic methods are used for the estimation. […] Material changes in proved reserve quantities could affect our depletion rates and, therefore, the Consolidated Financial Statements.
p. 112 · Read in context →
EQT Corporation — FY2023 Annual Report (Form 10-K) — FY2023
Pre-Equitrans baseline: a pure-play 'natural gas production company' with a single Production segment — the before to FY2025. · Open the full document →
Item 1. Business — General and Strategy — p. 10 · Read the full section →
Same company two years earlier, described only as a natural gas producer — no gathering or transmission segments yet.
Before Equitrans: 'a natural gas production company,' 27.6 Tcfe, largest U.S. gas producer by volume.
We are a natural gas production company with operations focused in the Appalachian Basin. As of December 31, 2023, we had 27.6 Tcfe of proved natural gas, NGLs and oil reserves across approximately 2.1 million gross acres, and, based on average daily sales volume, we were the largest producer of natural gas in the United States.
p. 10 · Read in context →
More annual reports
EQT Corporation — FY2024 Annual Report (Form 10-K) — FY2024 · 227 pages · The transition year: first report consolidating the Equitrans midstream assets acquired in July 2024. · Open →
EQT Corporation — FY2022 Annual Report (Form 10-K) — FY2022 · 213 pages · Peak-gas-price year; useful for seeing realized prices and cash flow before the midstream build-out. · Open →
EQT Corporation — FY2021 Annual Report (Form 10-K) — FY2021 · 176 pages · Early post-Rice-era upstream consolidation baseline for the Appalachian pure-play. · Open →