EQT Corporation's management explains the business in its own materials. The slides below do the most of that work, pulled from the documents preserved in Sources. Each source link opens the complete presentation at that slide in a new tab.
EQT's fullest current deck — the company, the gas-demand thesis, the LNG book and the balance sheet in one place. · Open the full document →
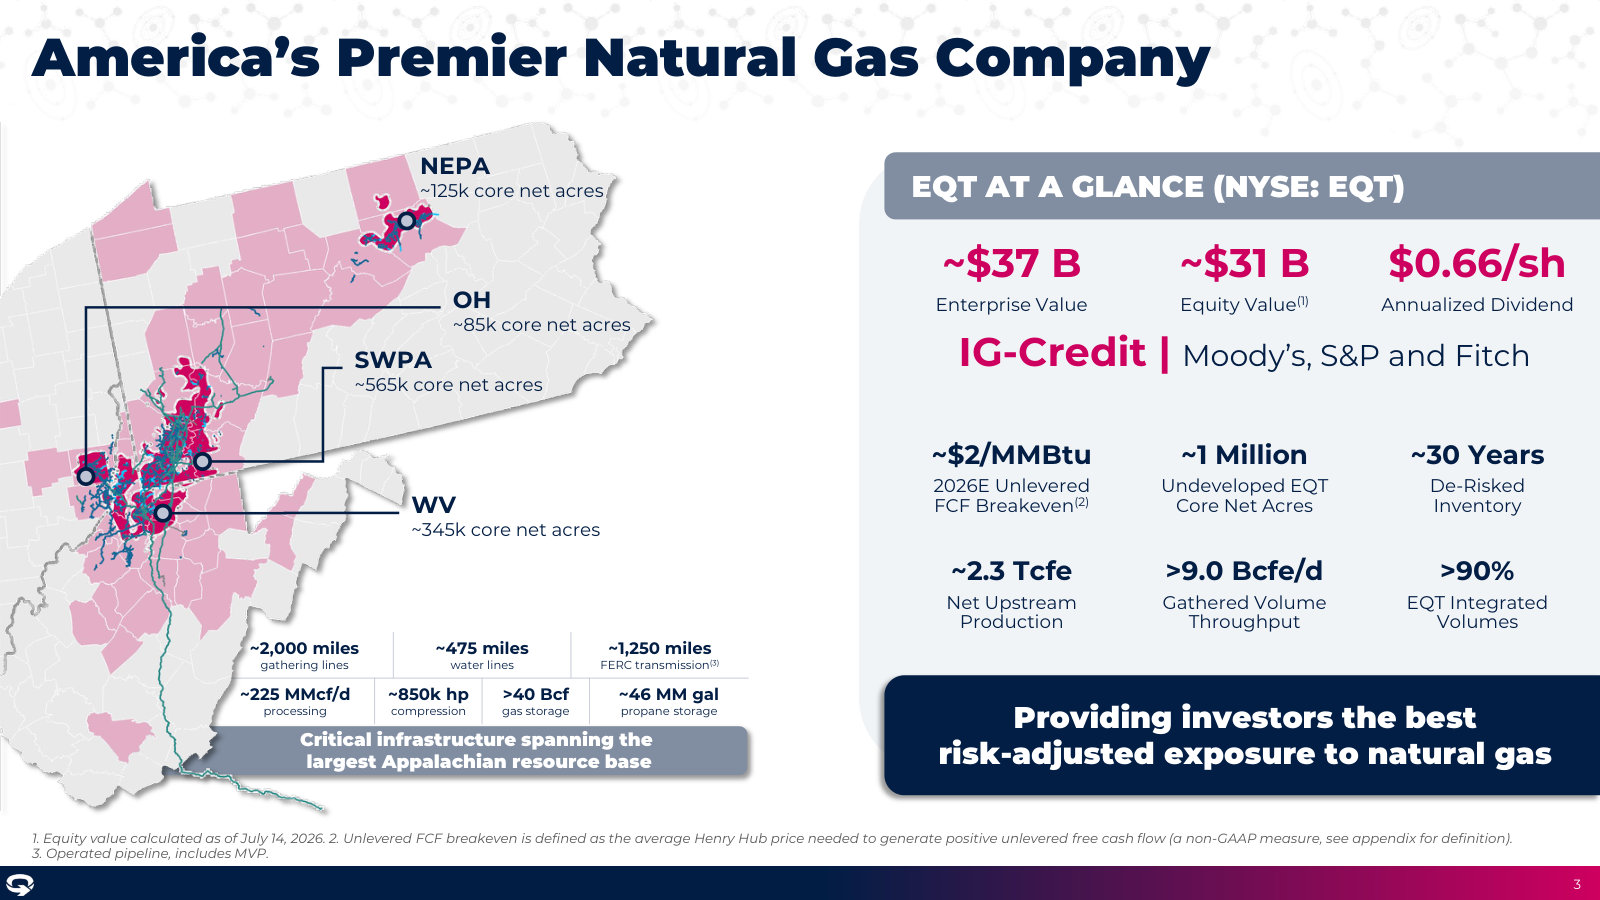
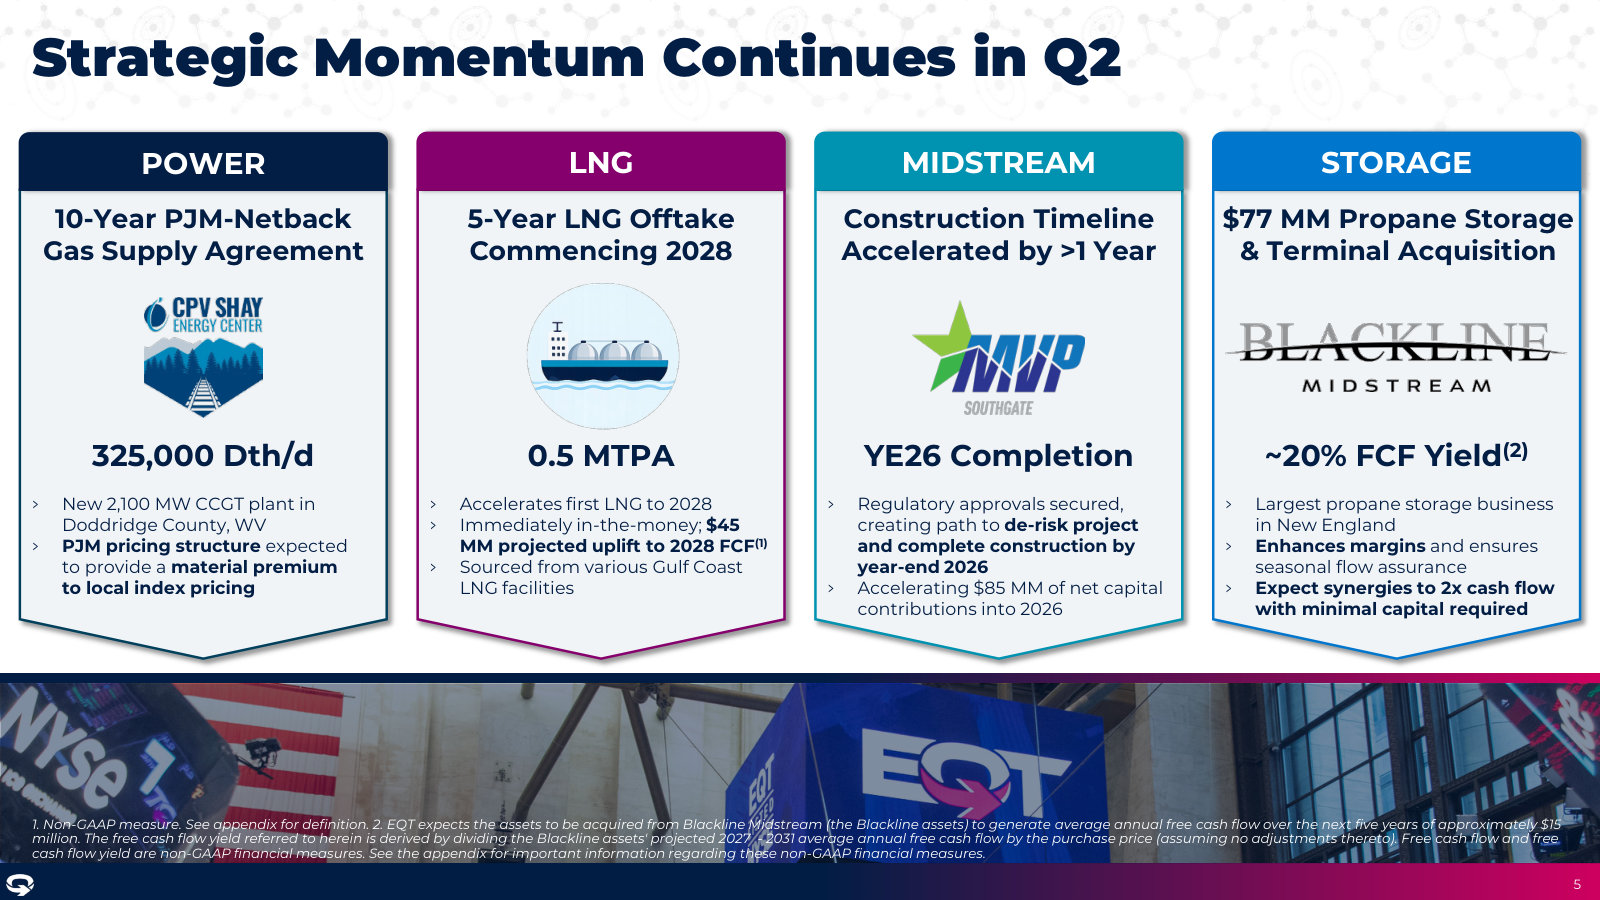
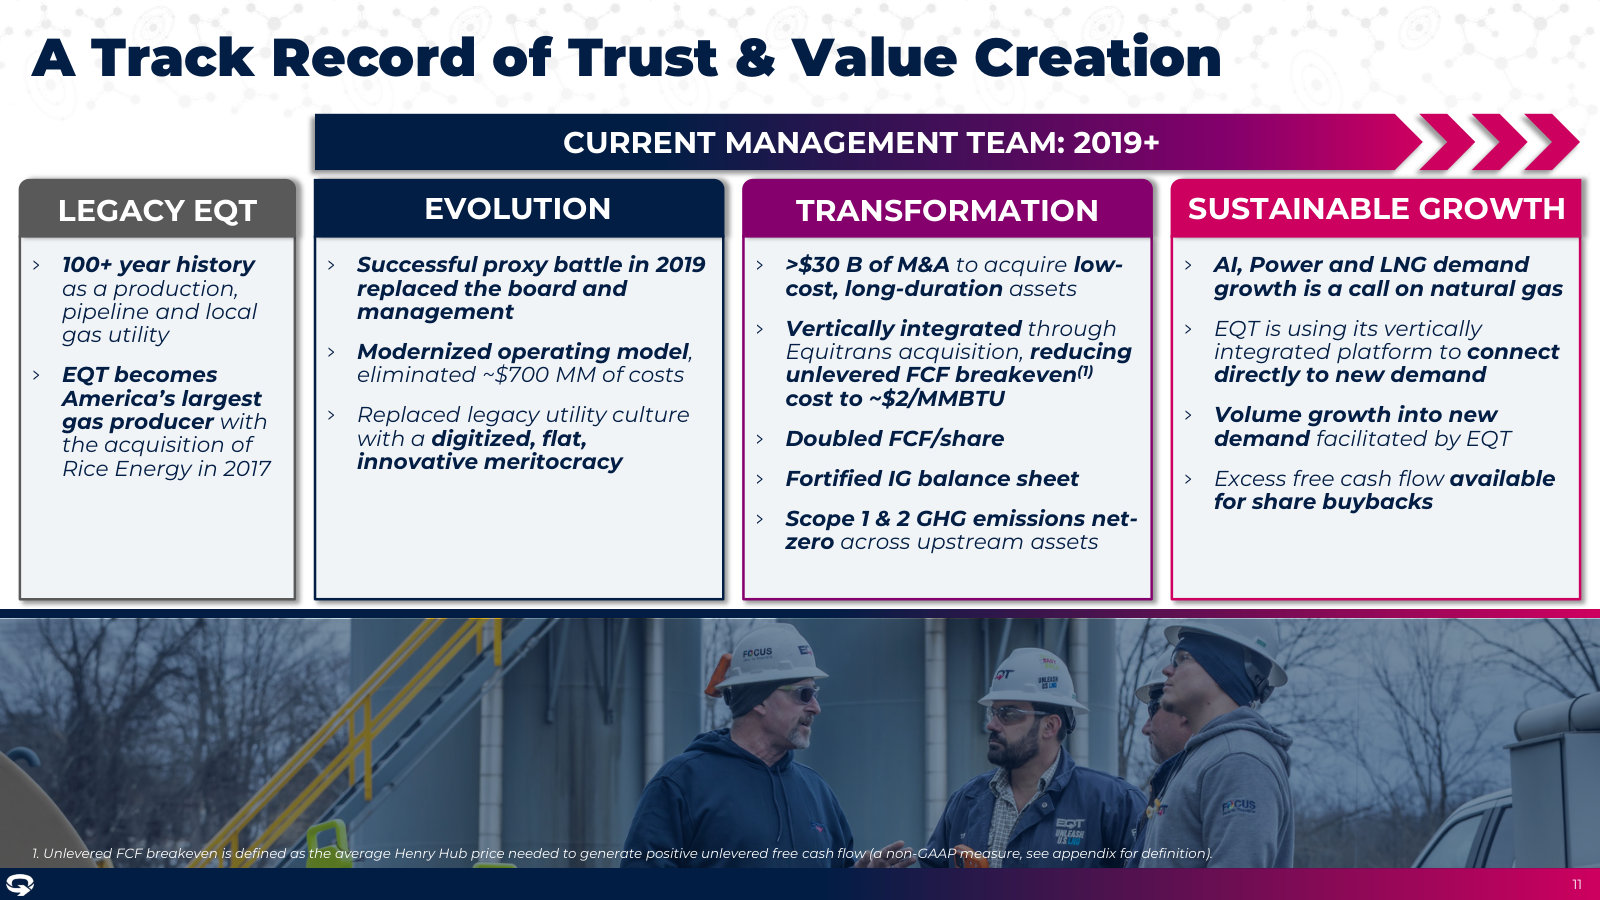
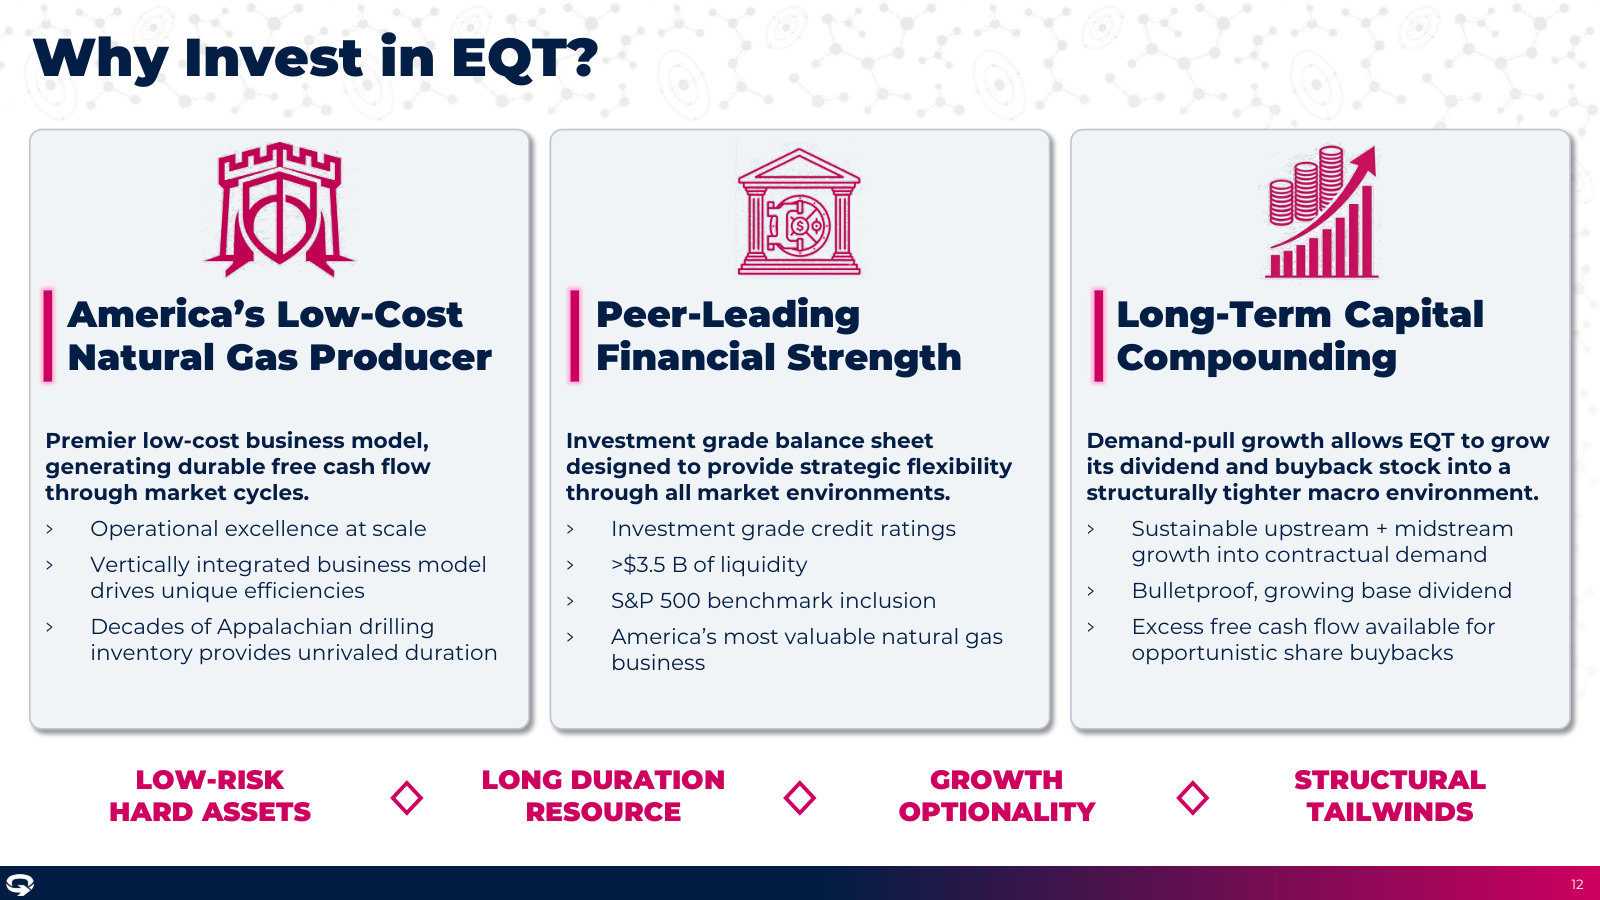
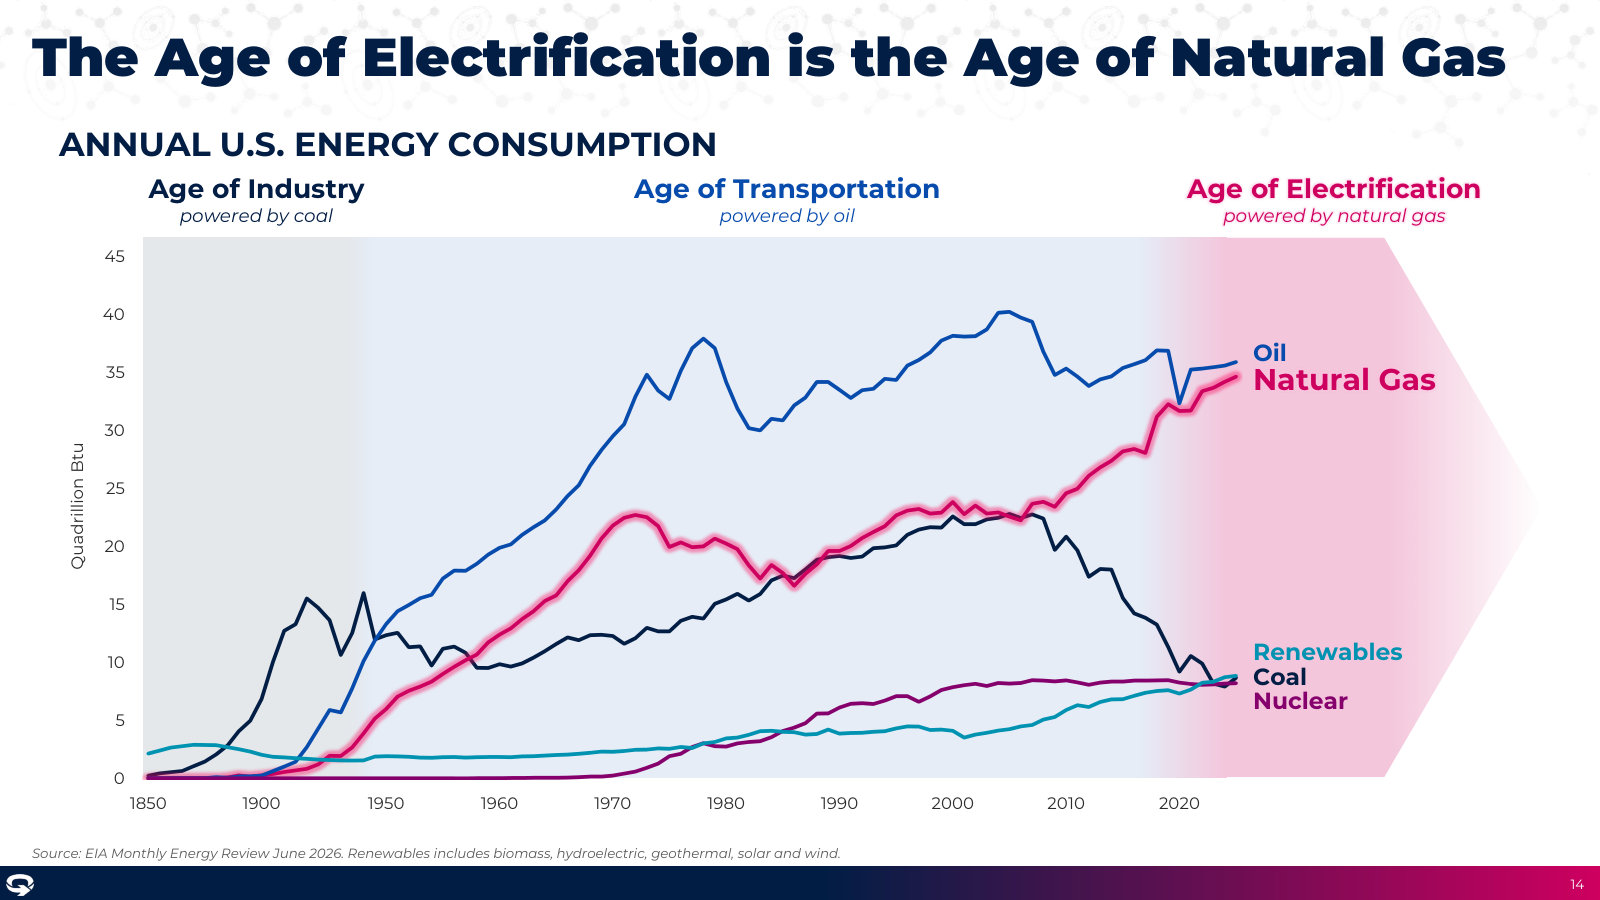
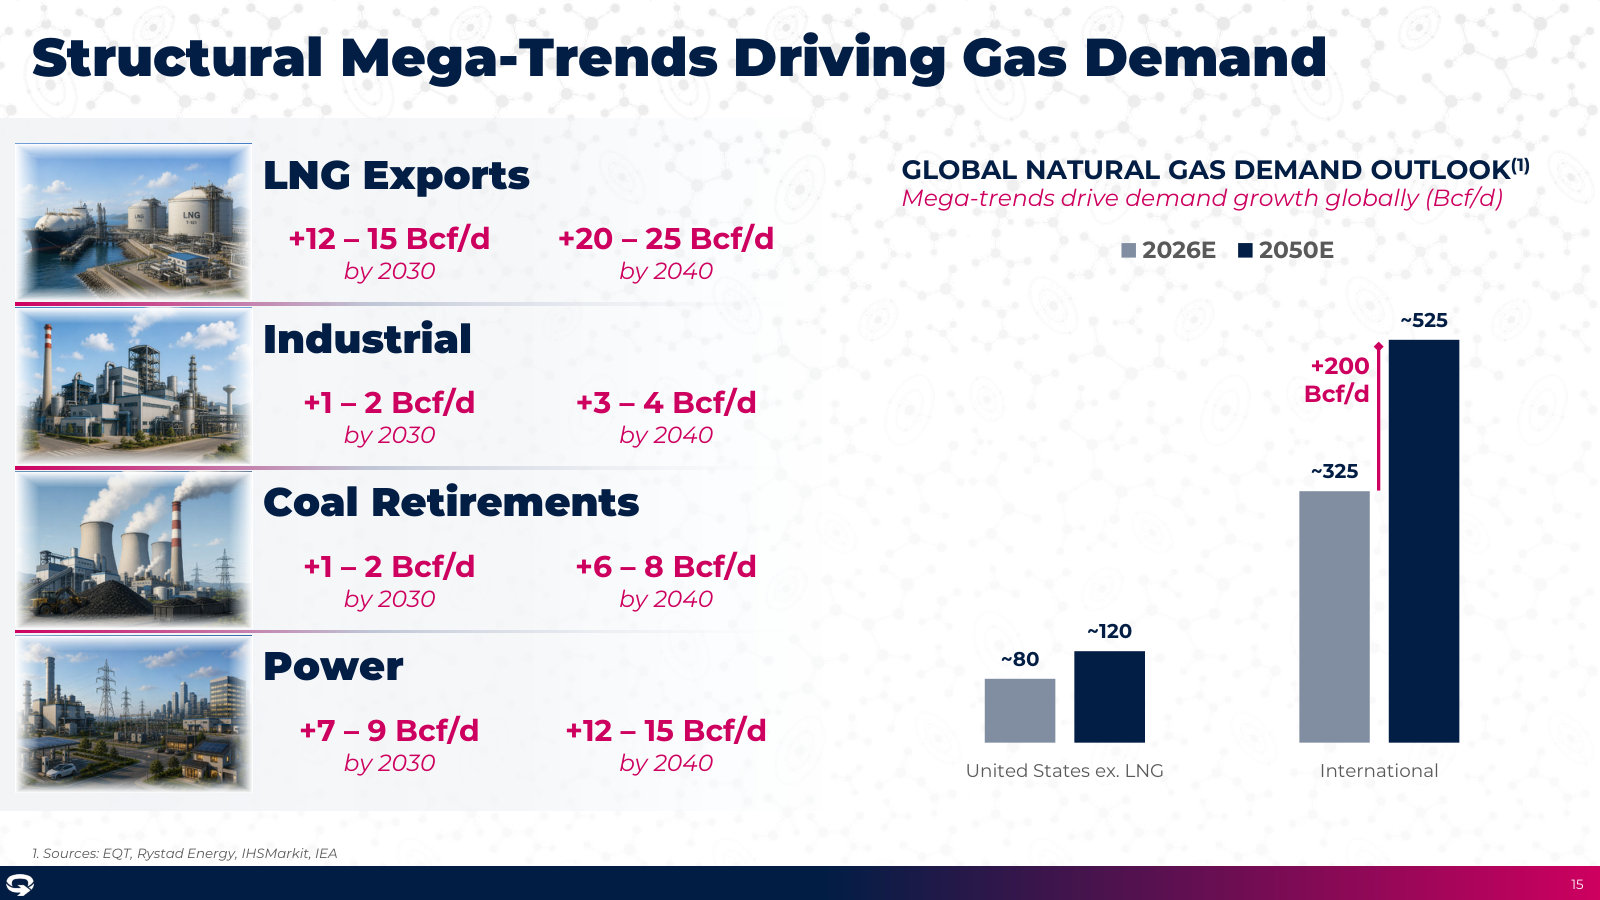
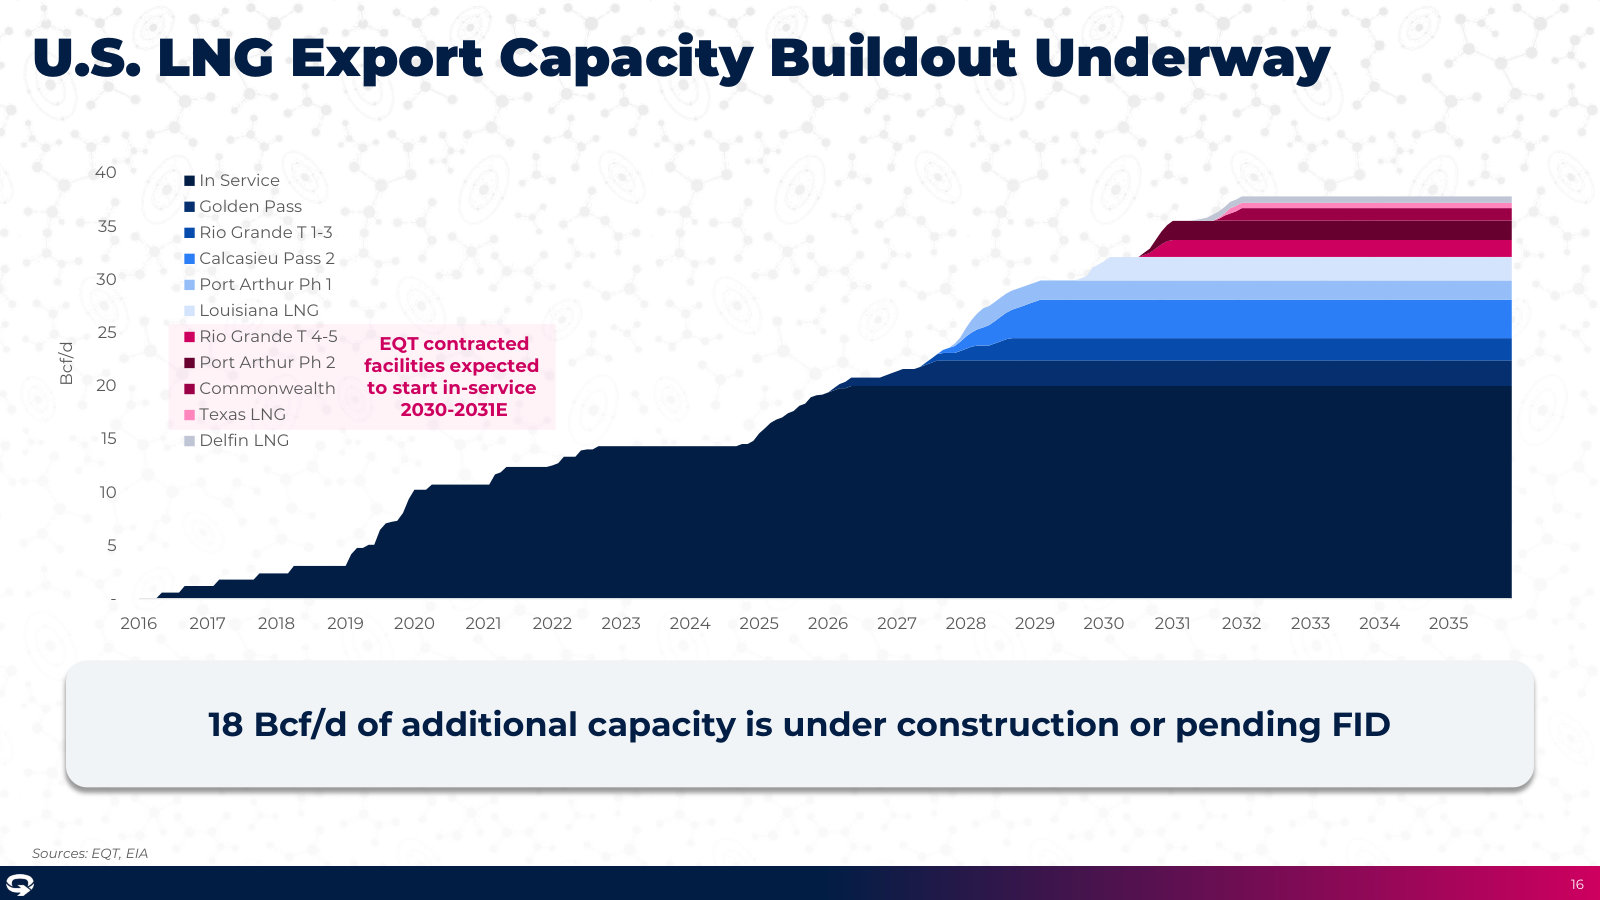
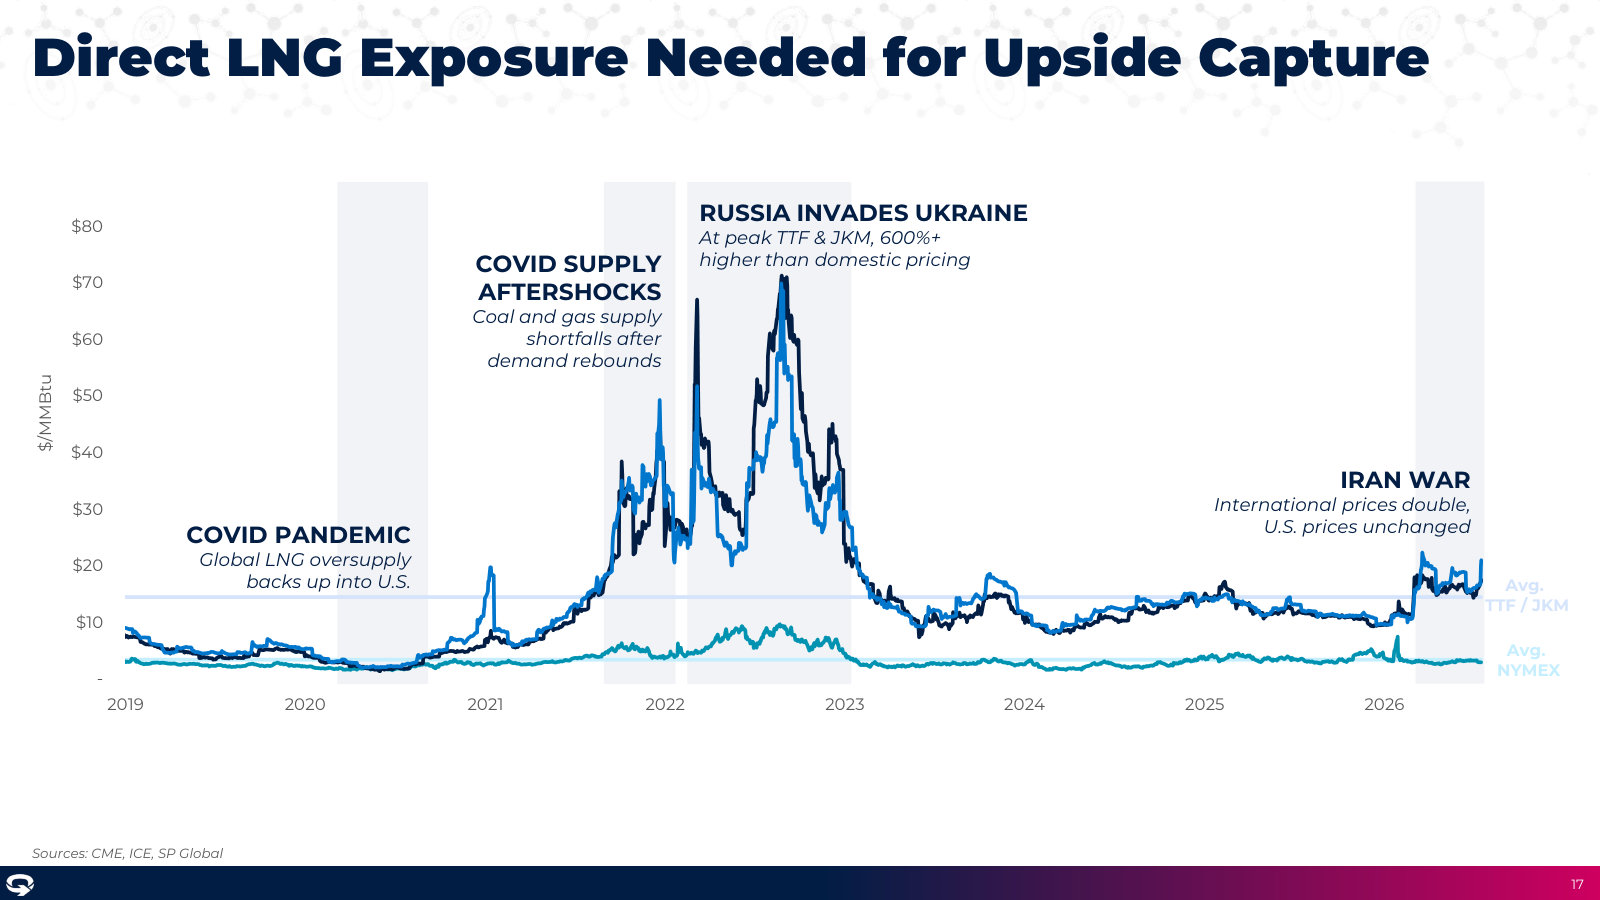
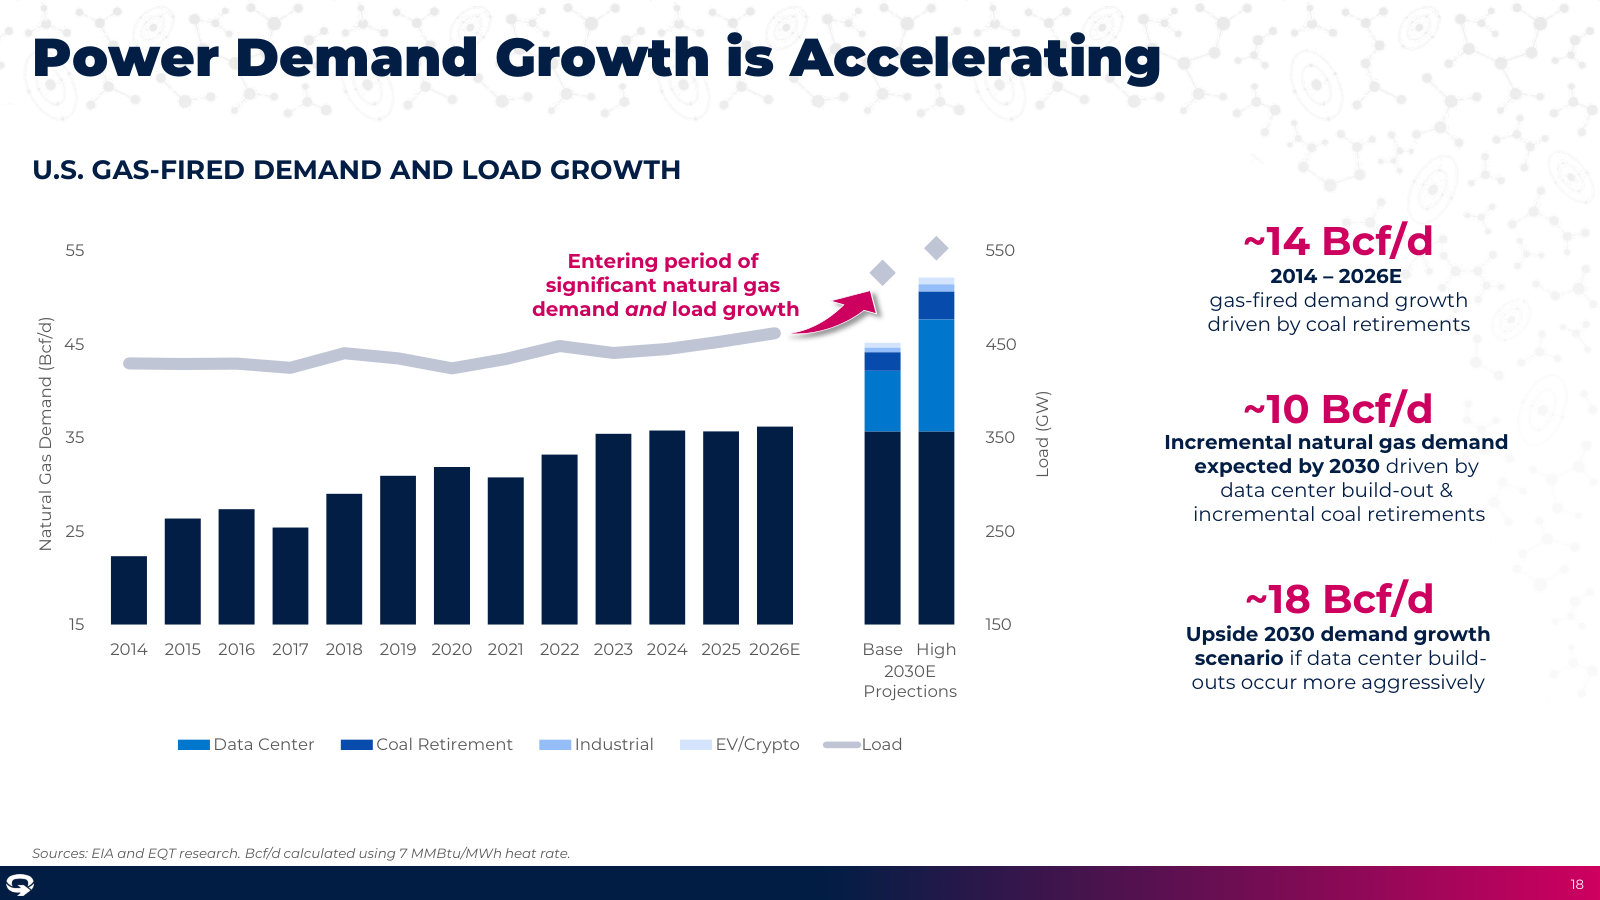
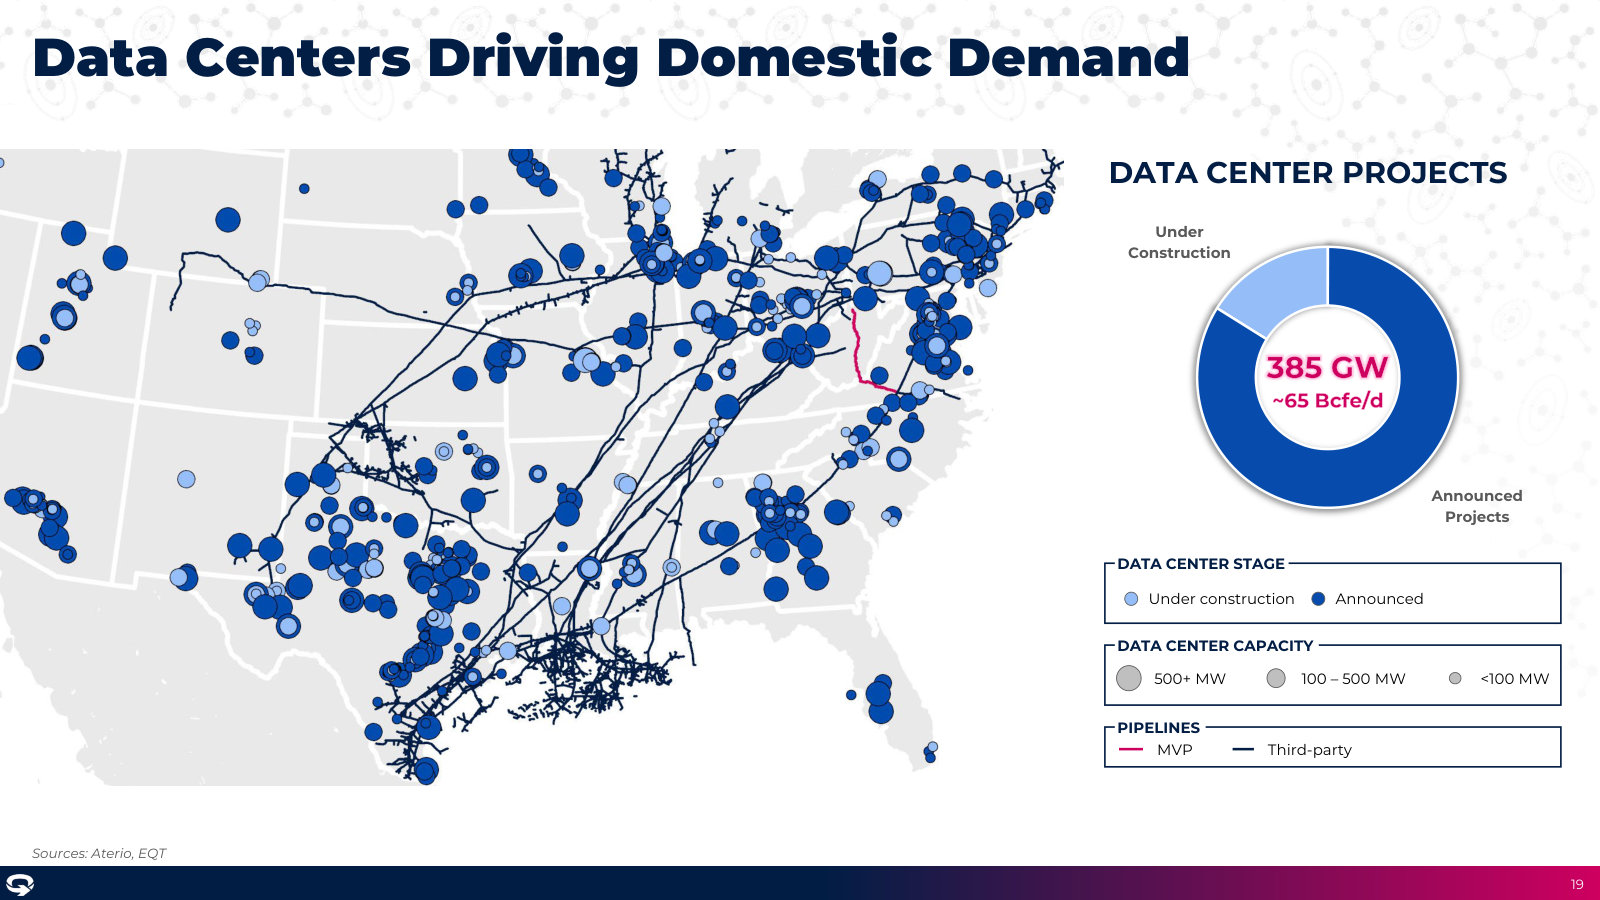
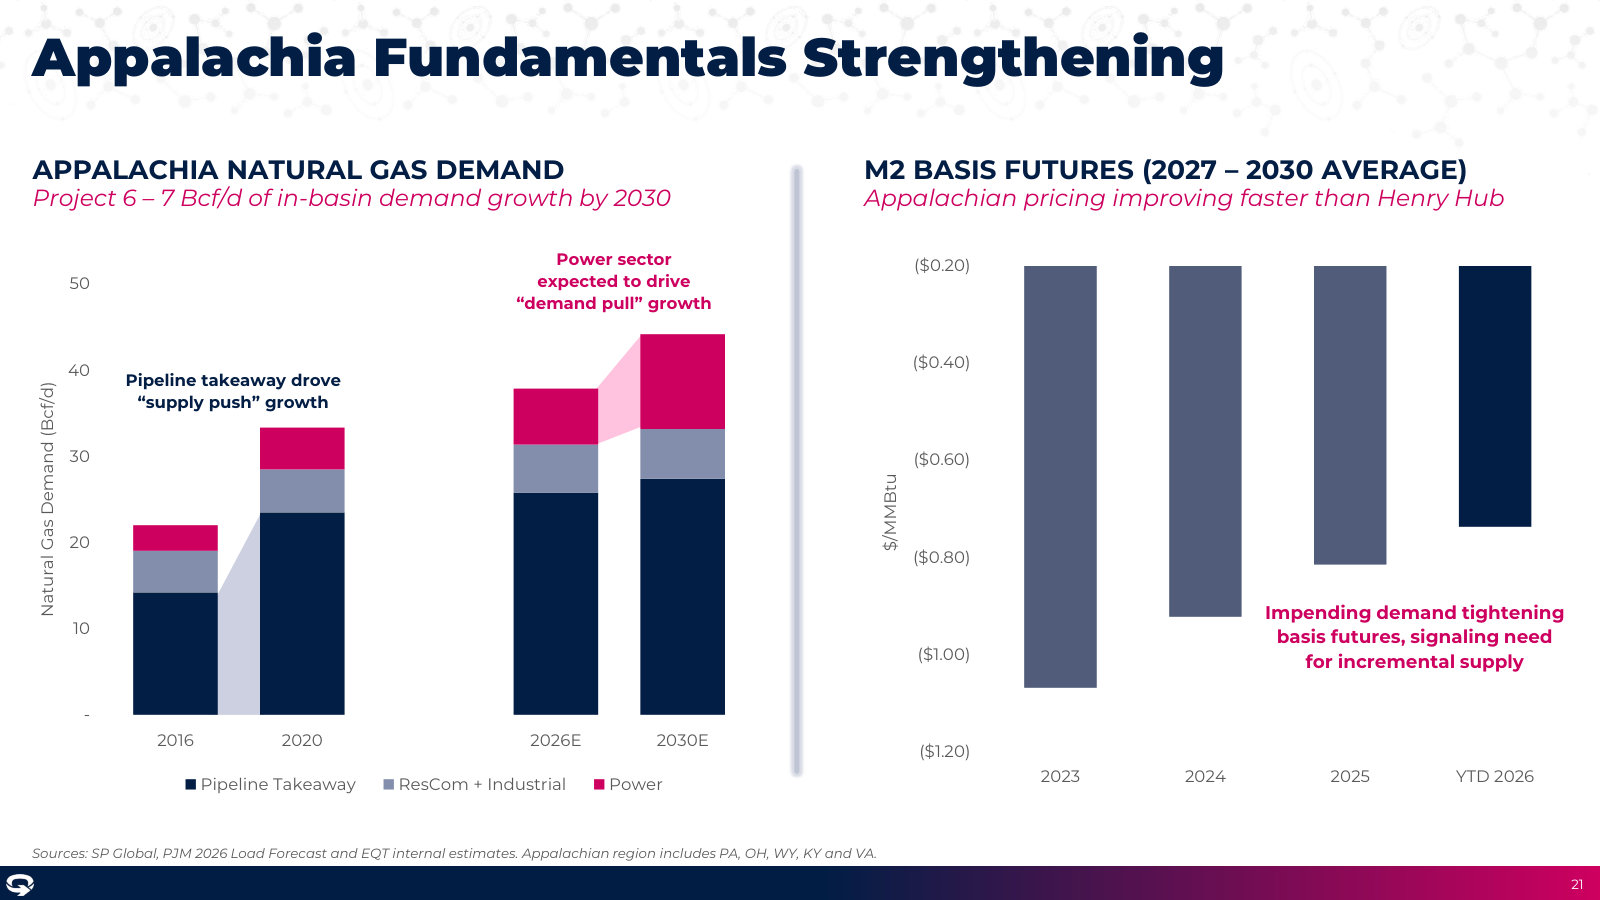
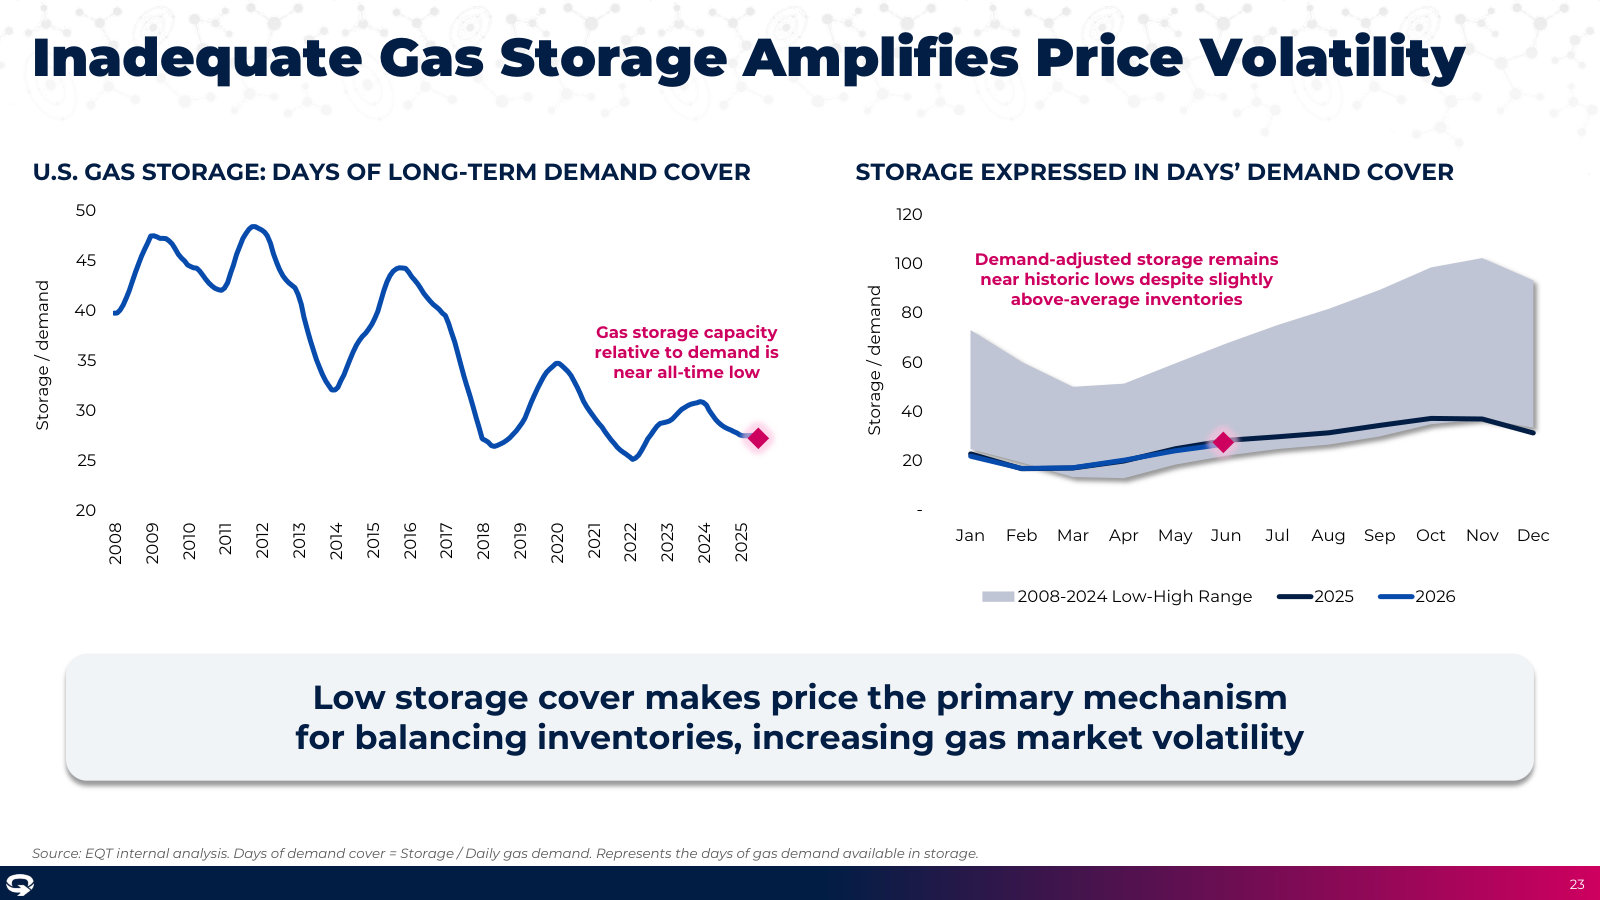
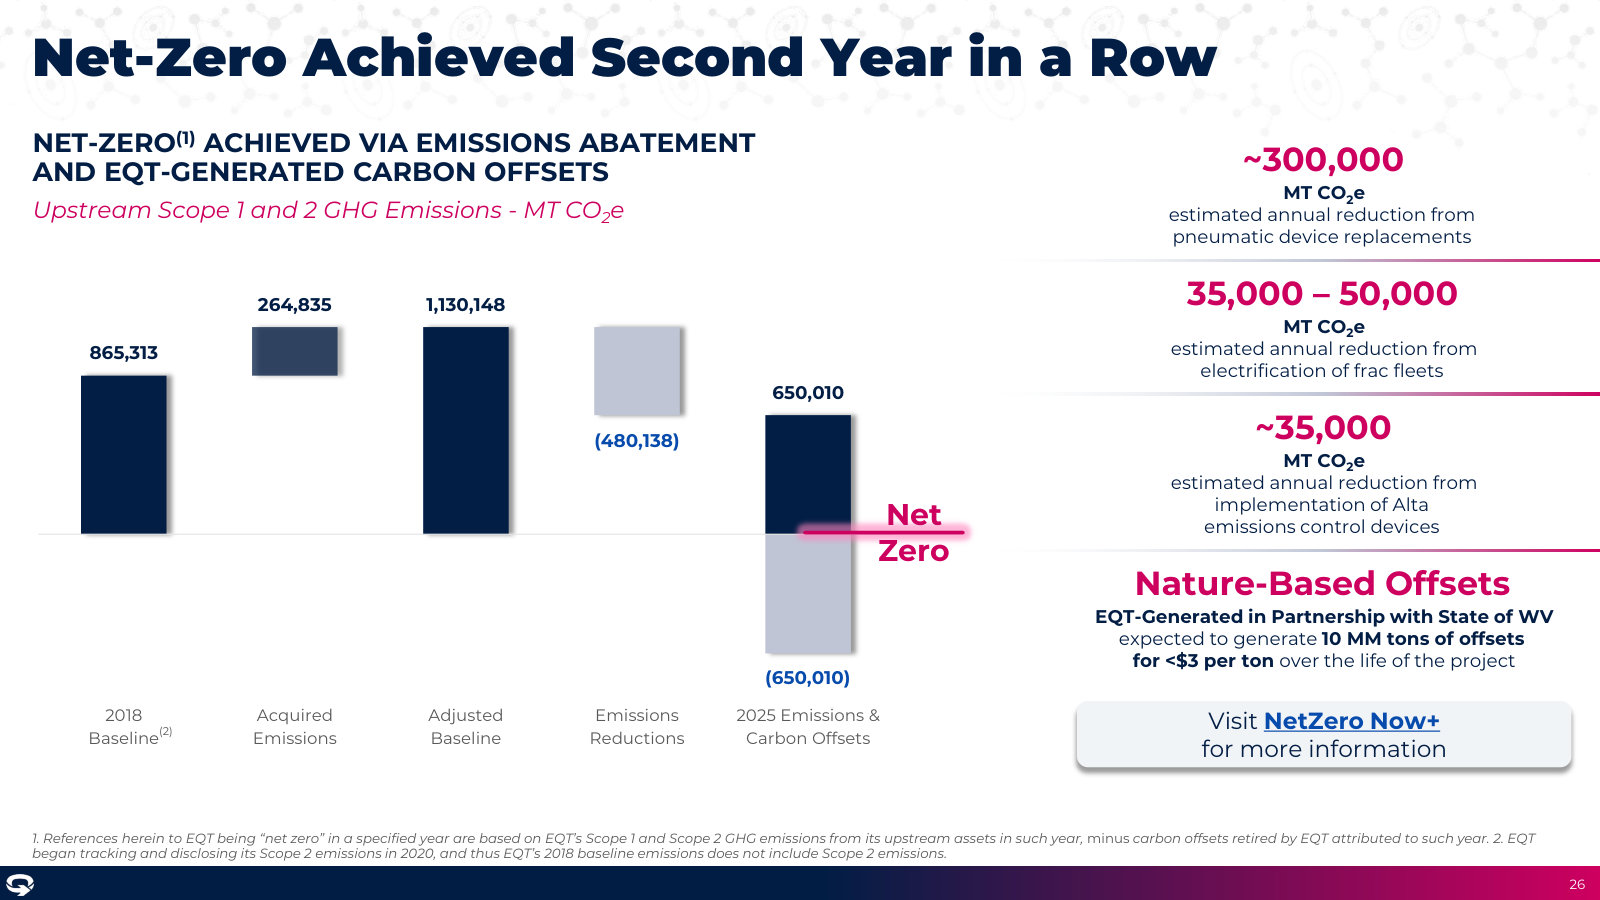
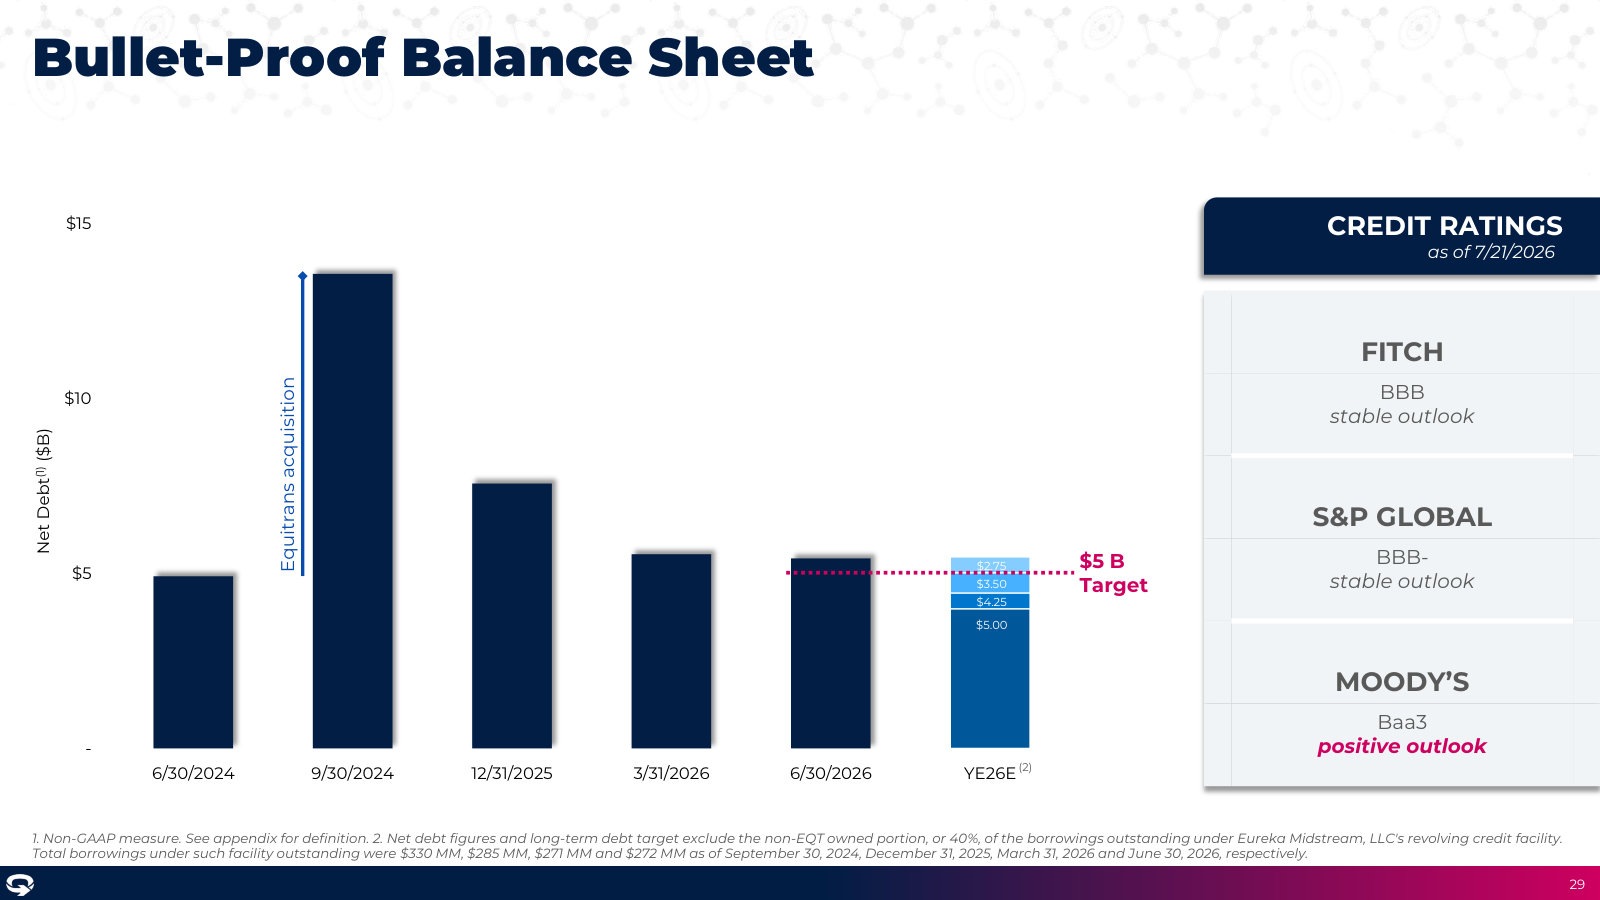
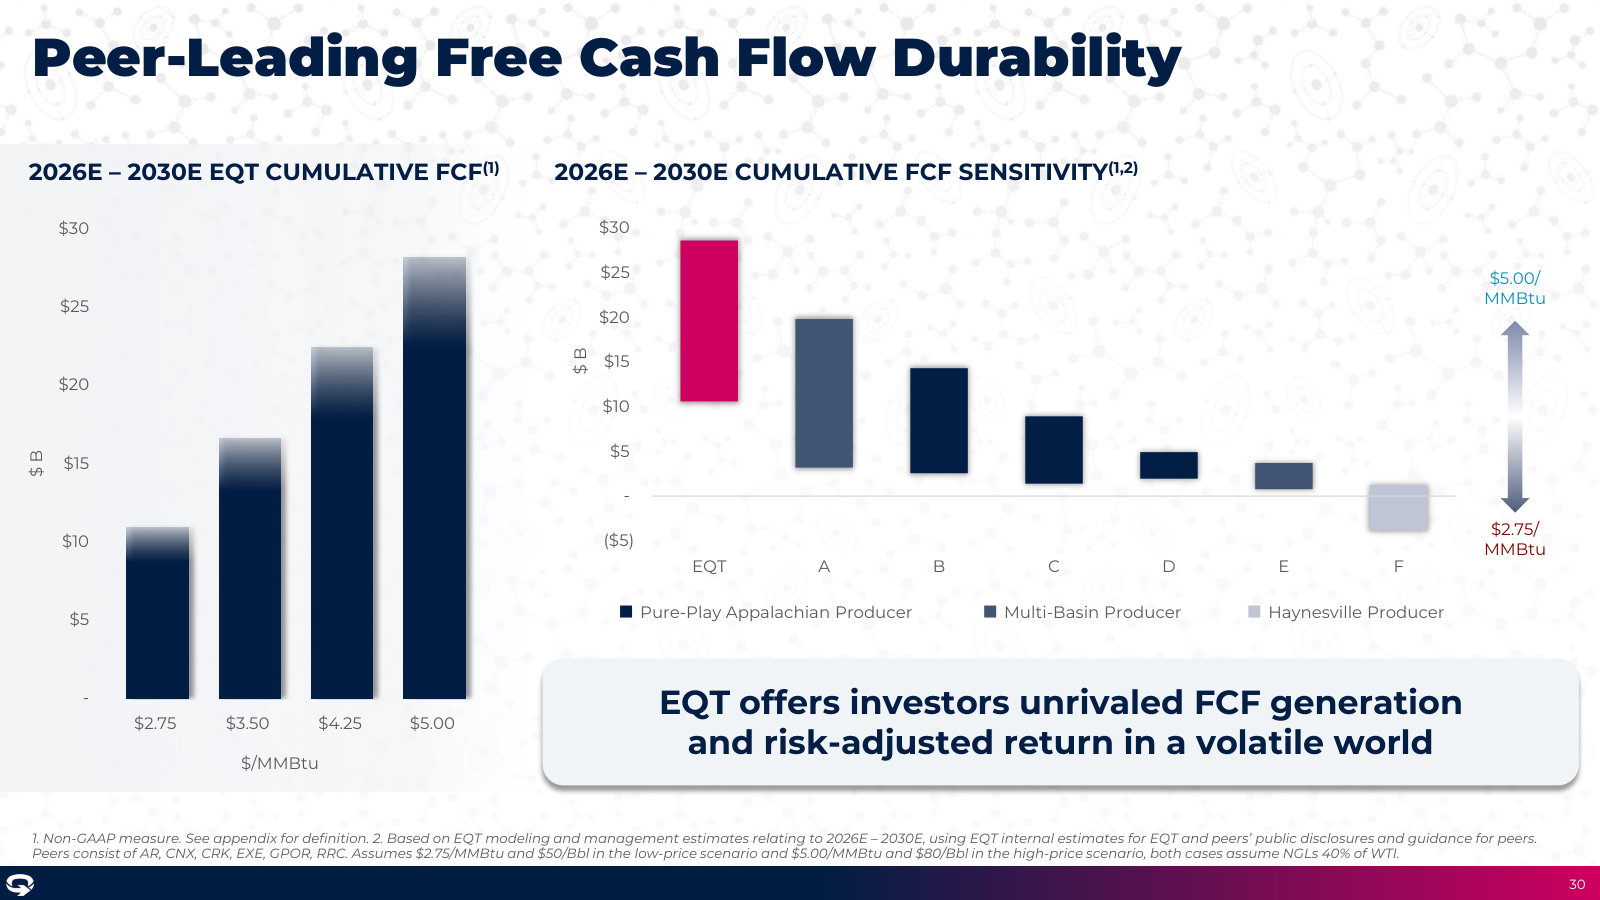
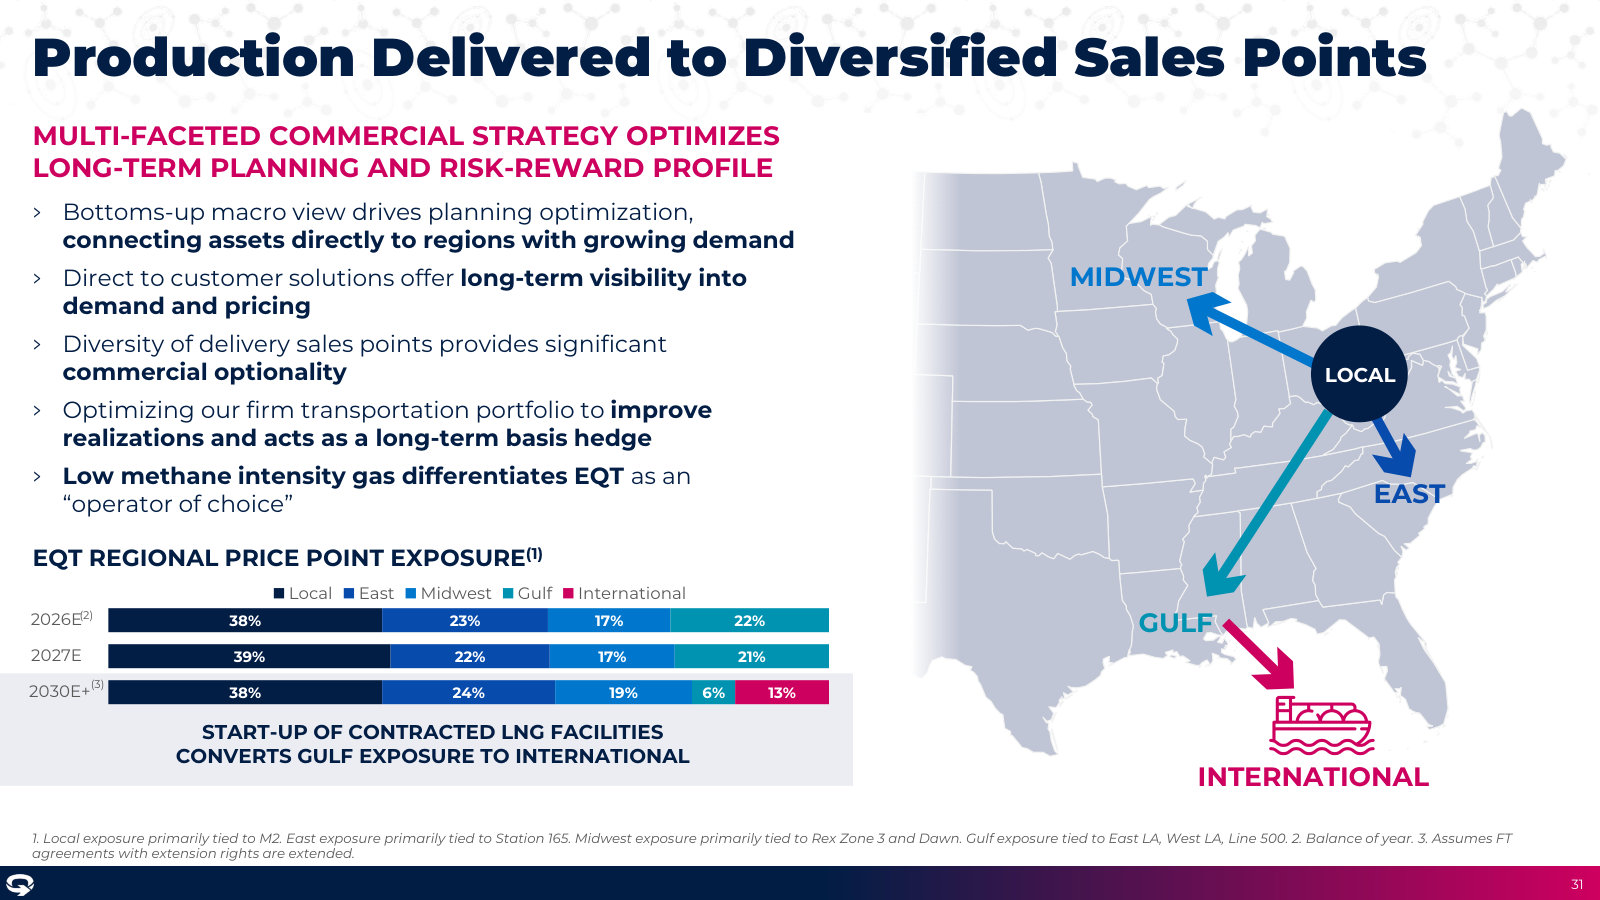
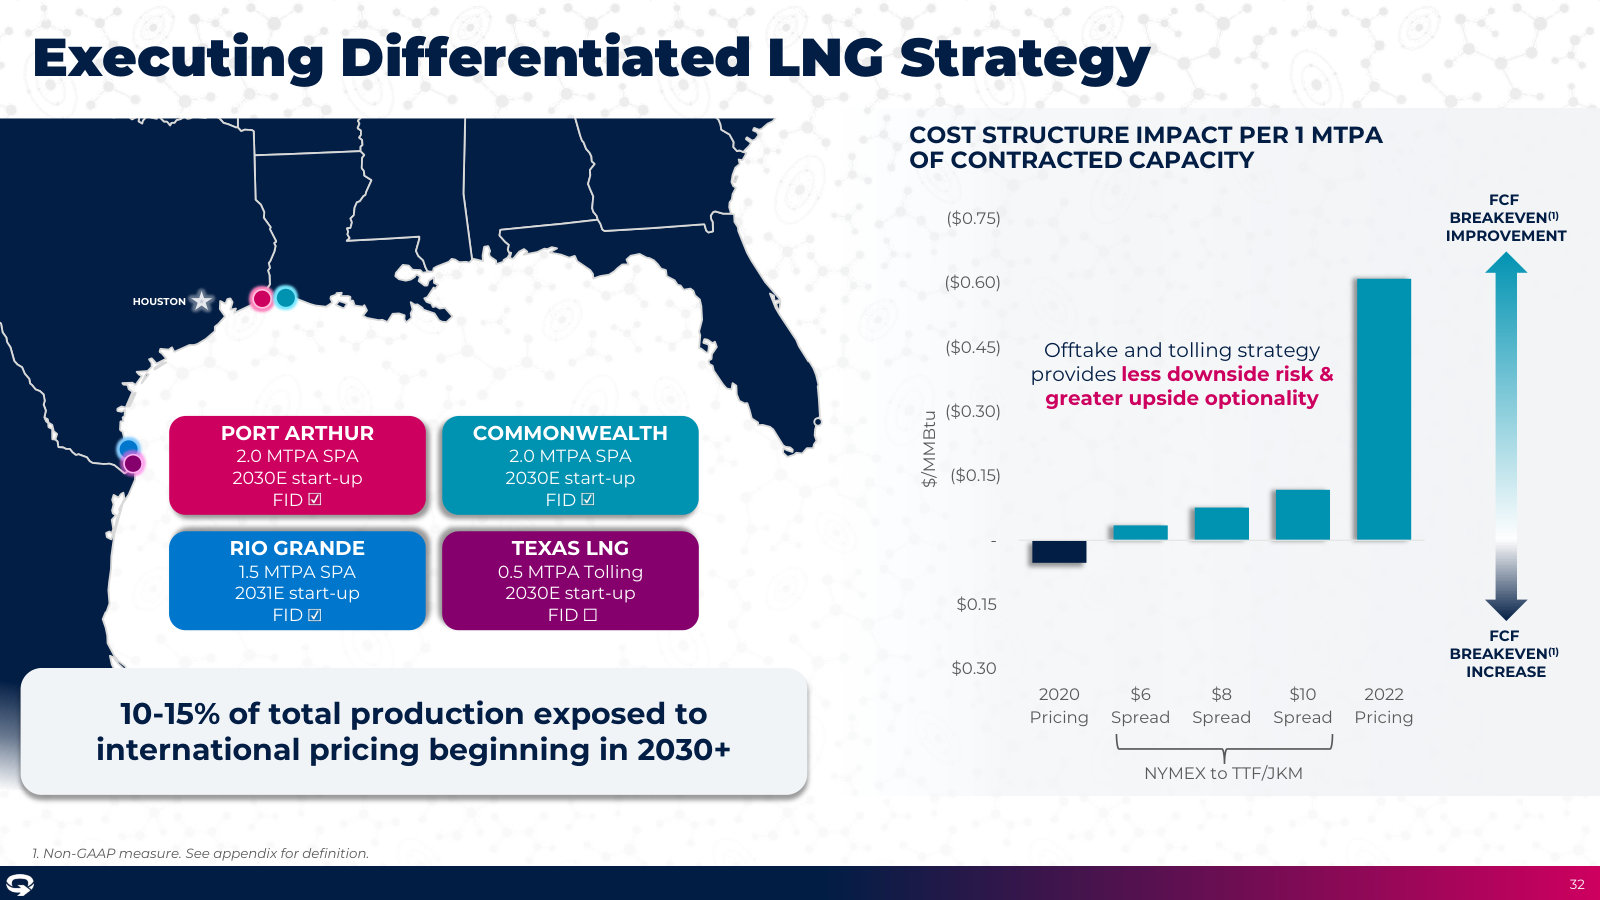
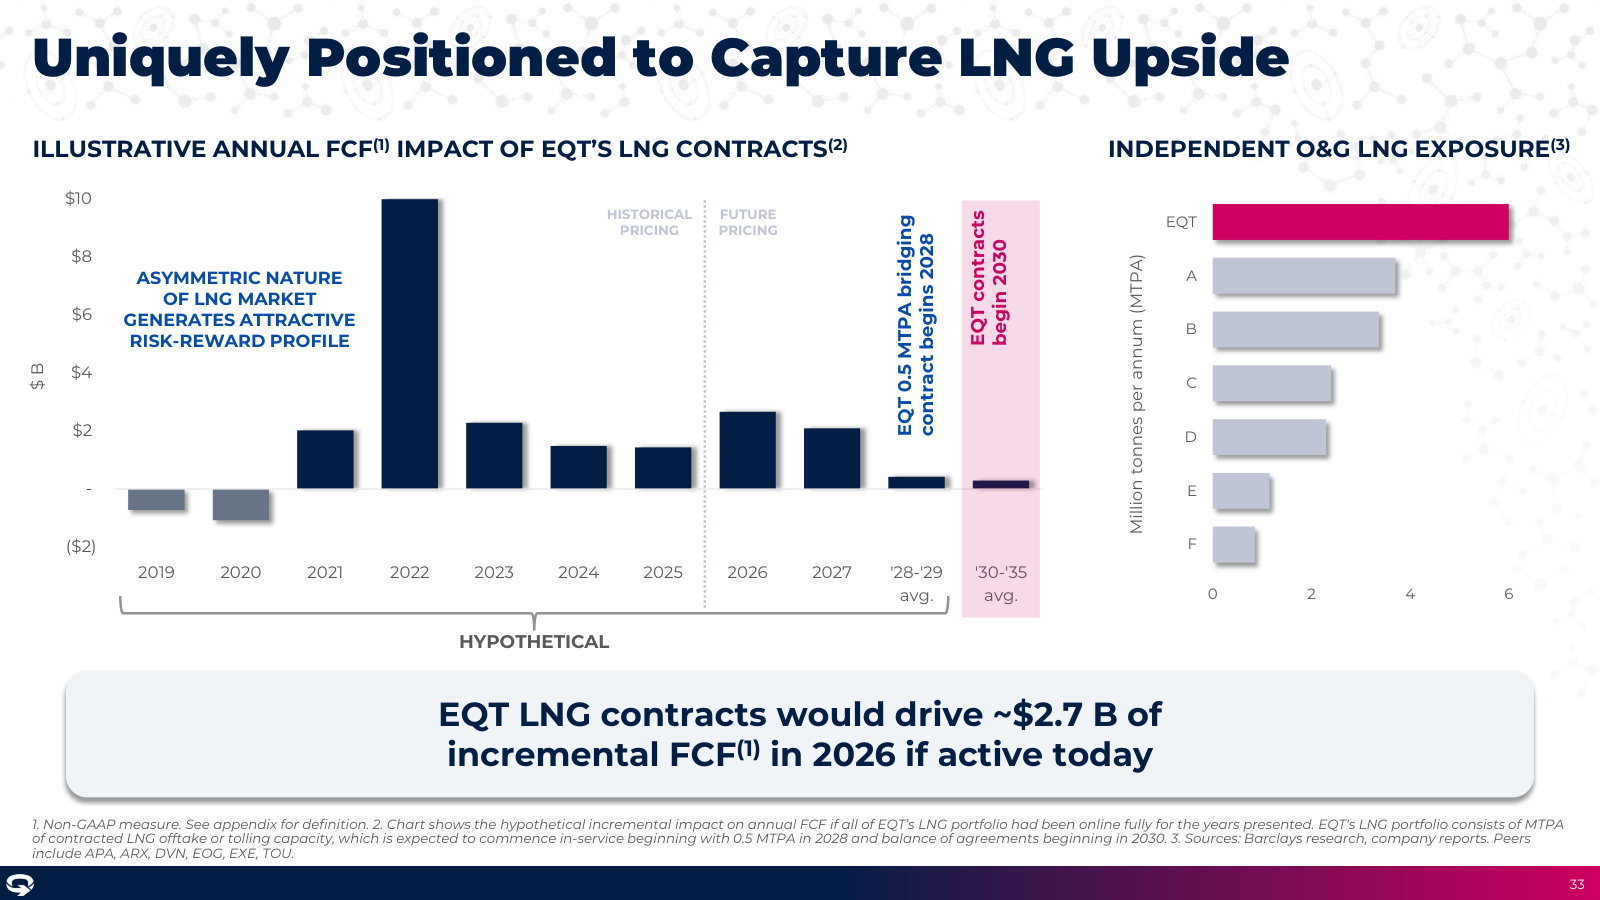
p. 3 — EQT at a glance — the Appalachian footprint by region, ~2.3 Tcfe production, ~$2/MMBtu FCF breakeven and the midstream it owns. · Open the full presentation →p. 5 — The four current growth vectors on one page — a power supply deal, LNG offtake, midstream (MVP Southgate) and a storage acquisition. · Open the full presentation →p. 11 — How EQT got here — from a legacy gas utility to America's largest producer, then integrated via Equitrans. · Open the full presentation →p. 12 — The investment case in three pillars — low-cost producer, investment-grade balance sheet, and demand-pull growth. · Open the full presentation →p. 14 — The core thesis in one chart — U.S. energy moved from coal to oil to an electrification era powered by natural gas. · Open the full presentation →p. 15 — Where the demand growth comes from, sized by driver — LNG exports, industrial, coal retirements and power — out to 2030 and 2040. · Open the full presentation →p. 16 — U.S. LNG export capacity by facility, with ~18 Bcf/d more under construction or pending FID, including plants EQT has contracted. · Open the full presentation →p. 17 — Why direct LNG exposure matters — international TTF/JKM prices spike far above U.S. NYMEX during supply shocks. · Open the full presentation →p. 18 — Power demand and grid load turning up after a flat decade, driven by data centers and coal retirements. · Open the full presentation →p. 19 — Data-center projects mapped against gas pipelines — ~385 GW announced or under construction, much of it near EQT's assets. · Open the full presentation →p. 21 — Appalachia shifting from supply-push to demand-pull growth, with local M2 basis expected to tighten toward Henry Hub. · Open the full presentation →p. 23 — Gas storage relative to demand sits near all-time lows — management's argument for structurally higher price volatility. · Open the full presentation →p. 26 — How EQT reaches net-zero Scope 1 & 2 — emissions abatement plus company-generated carbon offsets, a second year running. · Open the full presentation →p. 29 — The de-leveraging trajectory — net debt falling from the Equitrans-close peak toward a $5B target, with all three agency ratings. · Open the full presentation →p. 30 — Cumulative 2026-30 free cash flow across gas prices, and versus peers — the durability-of-FCF argument in two charts. · Open the full presentation →p. 31 — The commercial model — where EQT's gas is actually sold (local, East, Midwest, Gulf, international) and how that mix shifts to 2030. · Open the full presentation →p. 32 — The LNG contract portfolio — Port Arthur, Commonwealth, Rio Grande, Texas LNG — and its modest effect on cost structure. · Open the full presentation →p. 33 — What the LNG book is worth — illustrative annual FCF impact and EQT's LNG exposure relative to other independents. · Open the full presentation →
The first deck after the July 2024 Equitrans close — the clearest account of how EQT became integrated. · Open the full document →
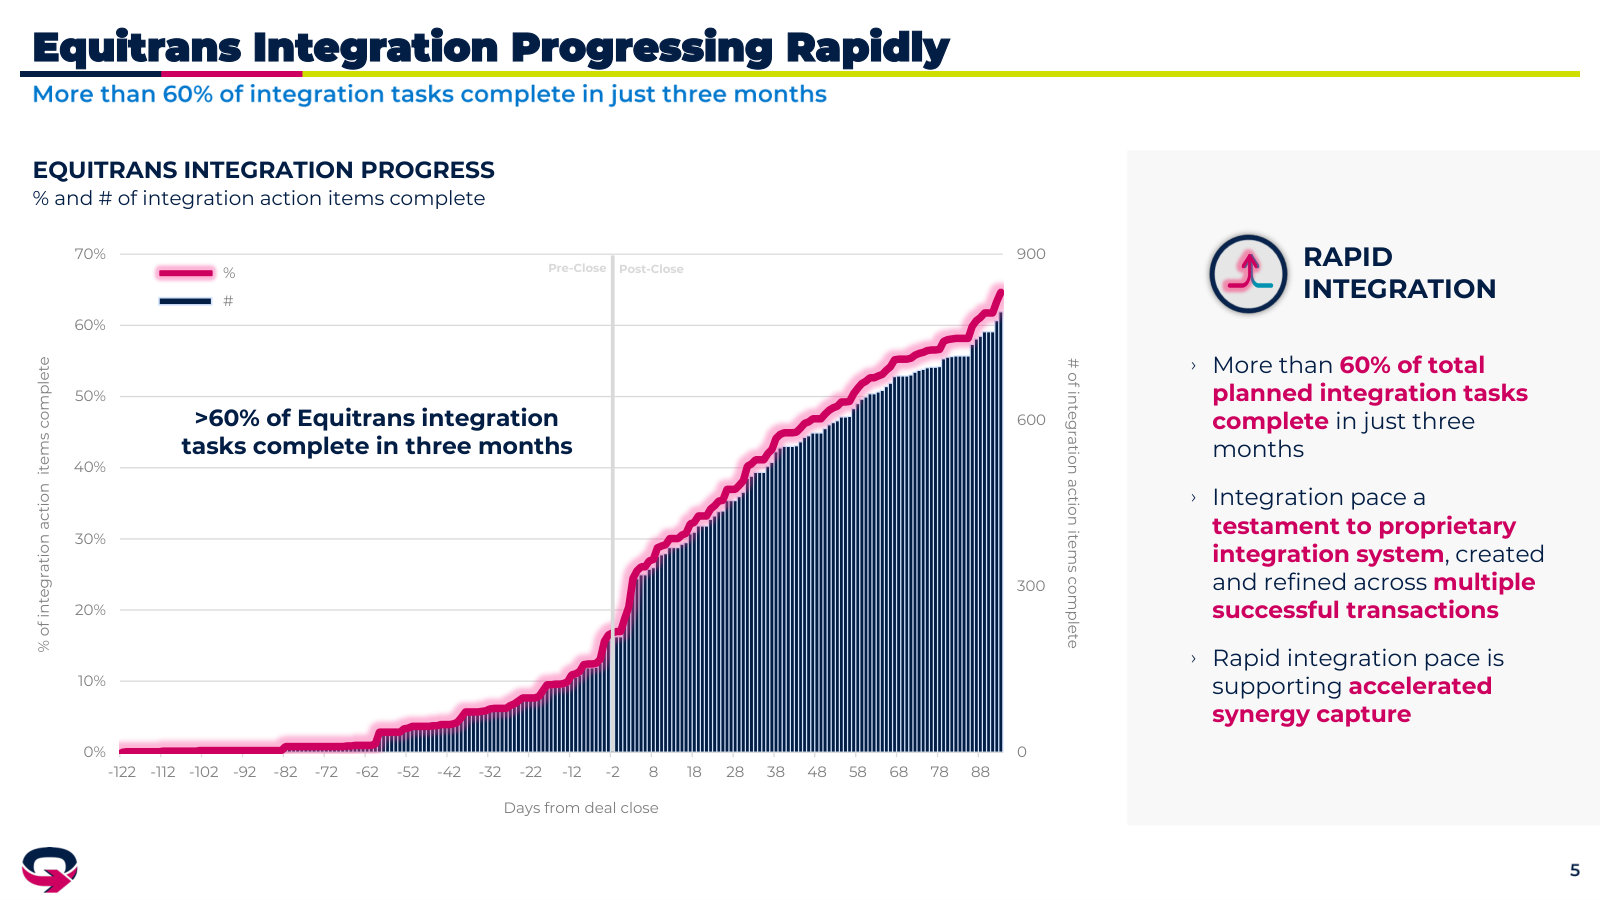
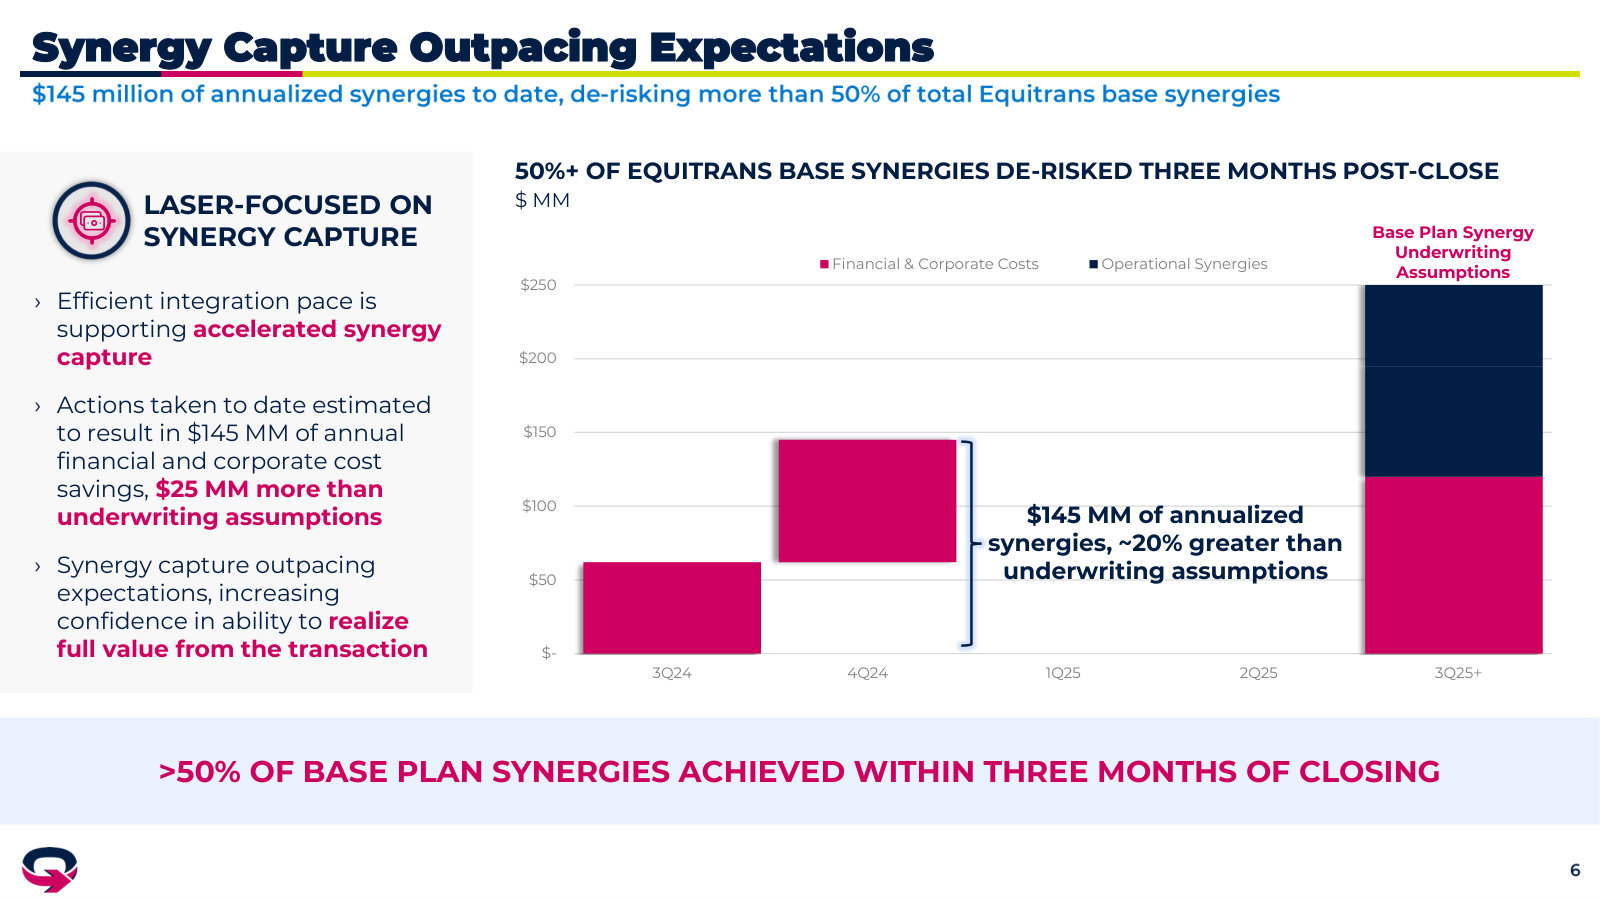
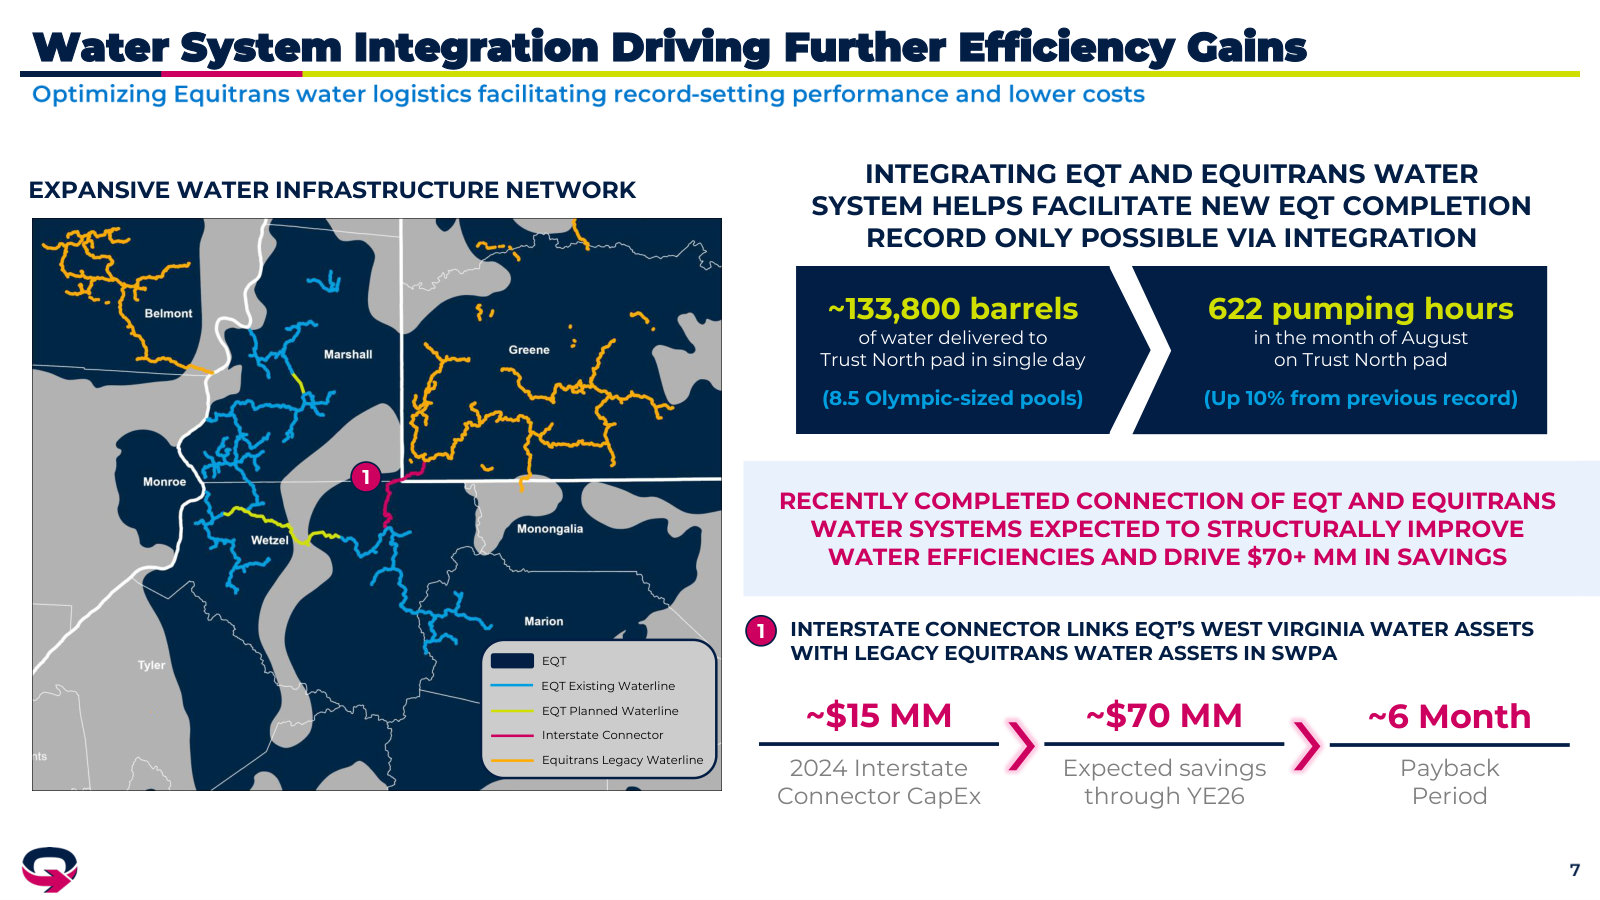
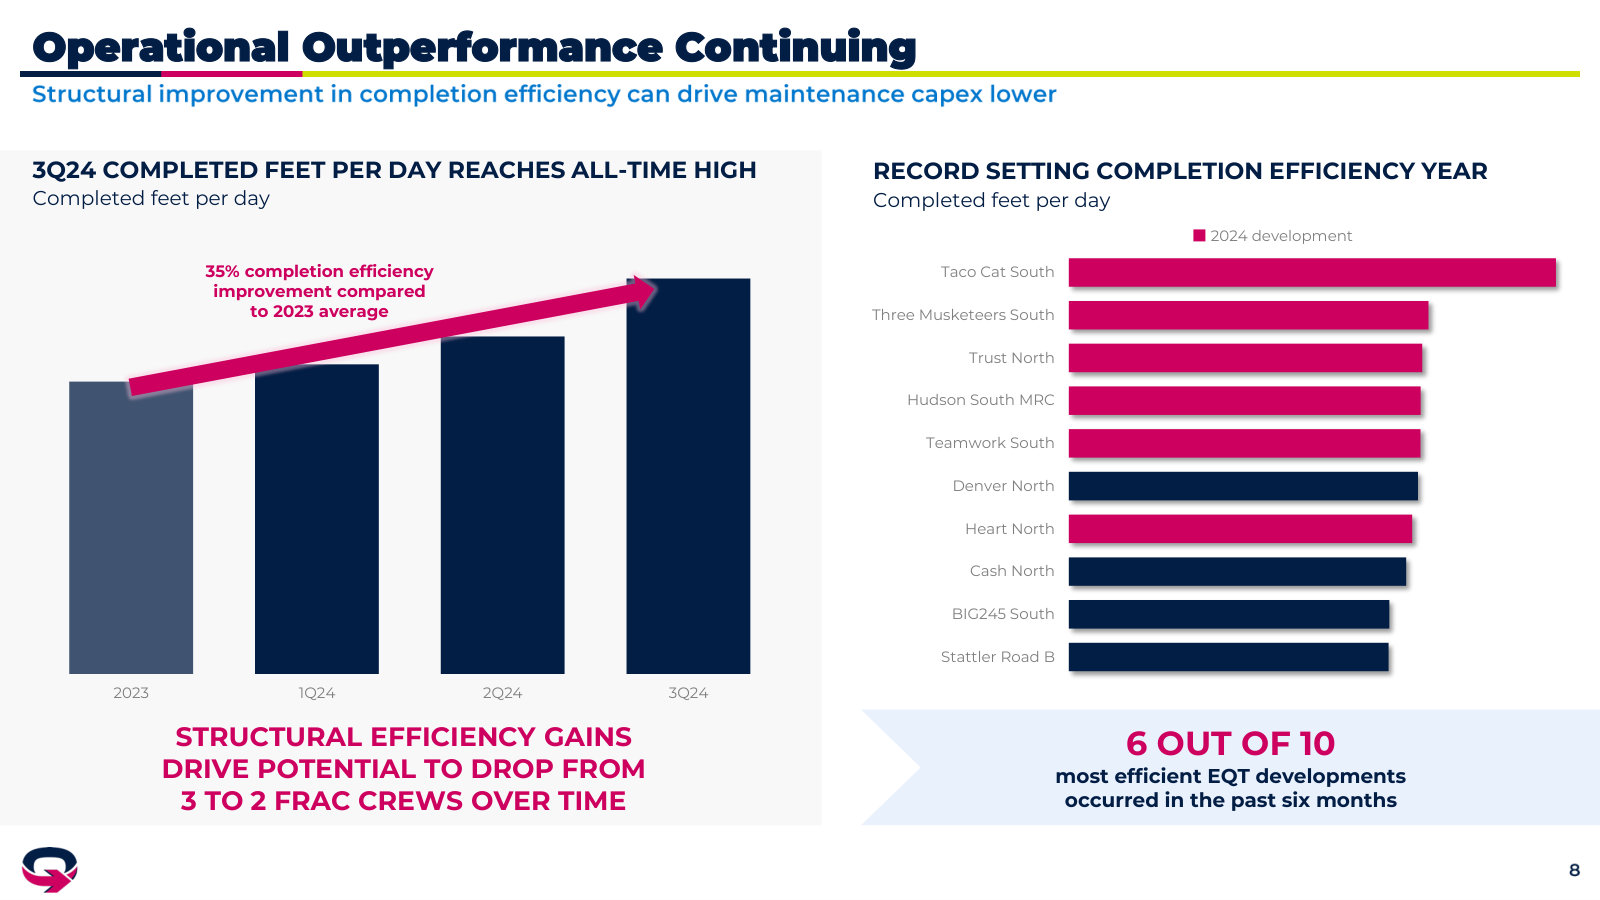
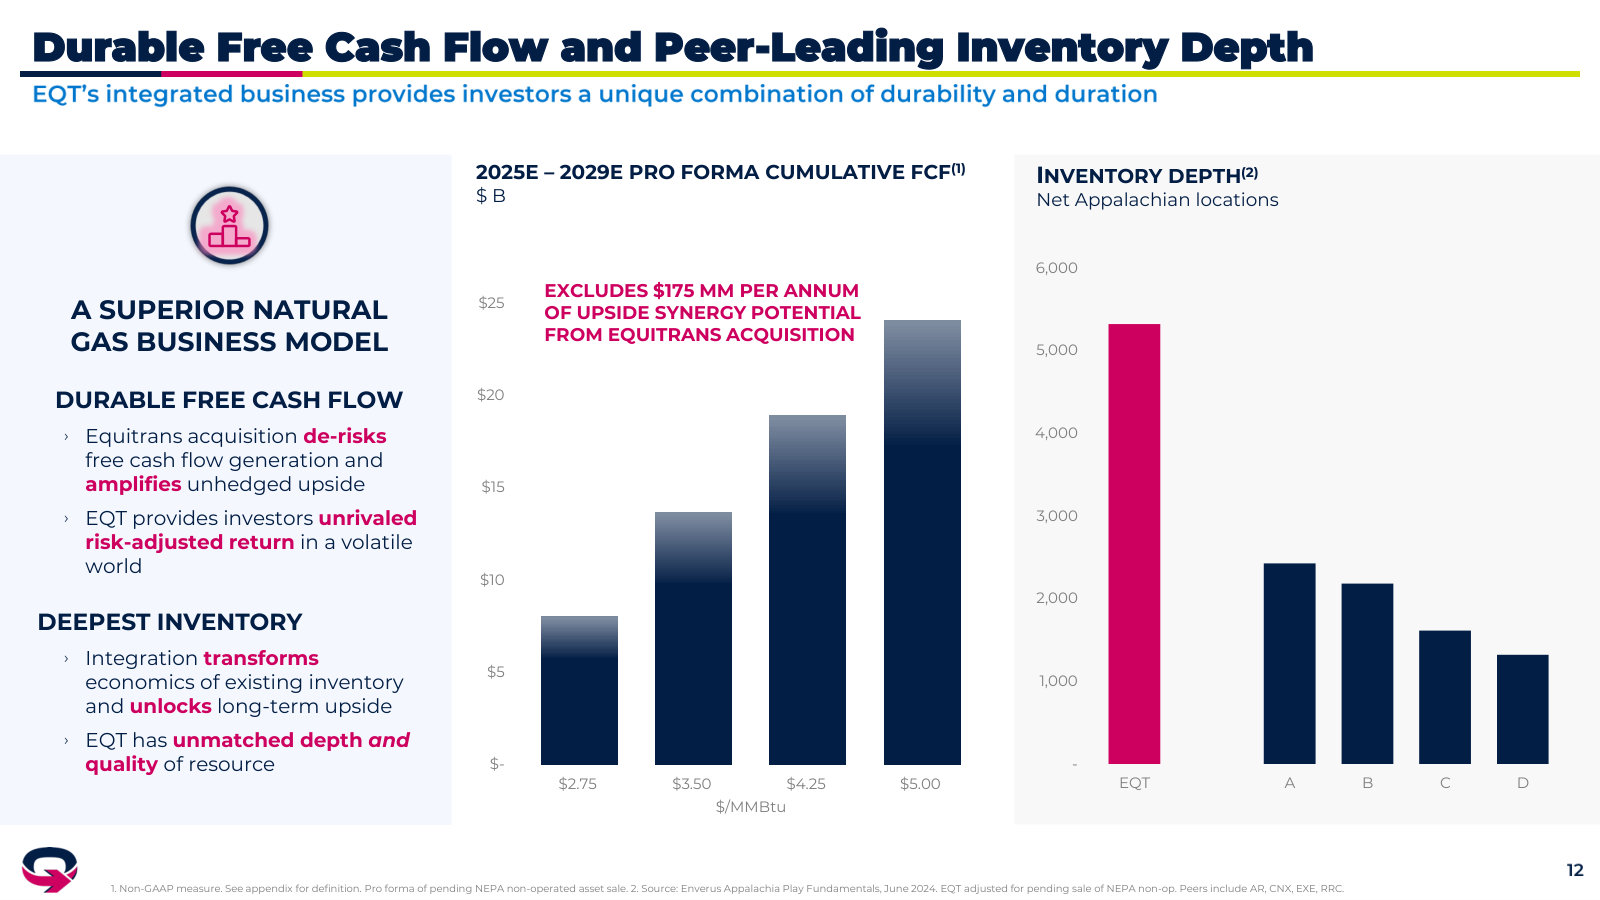
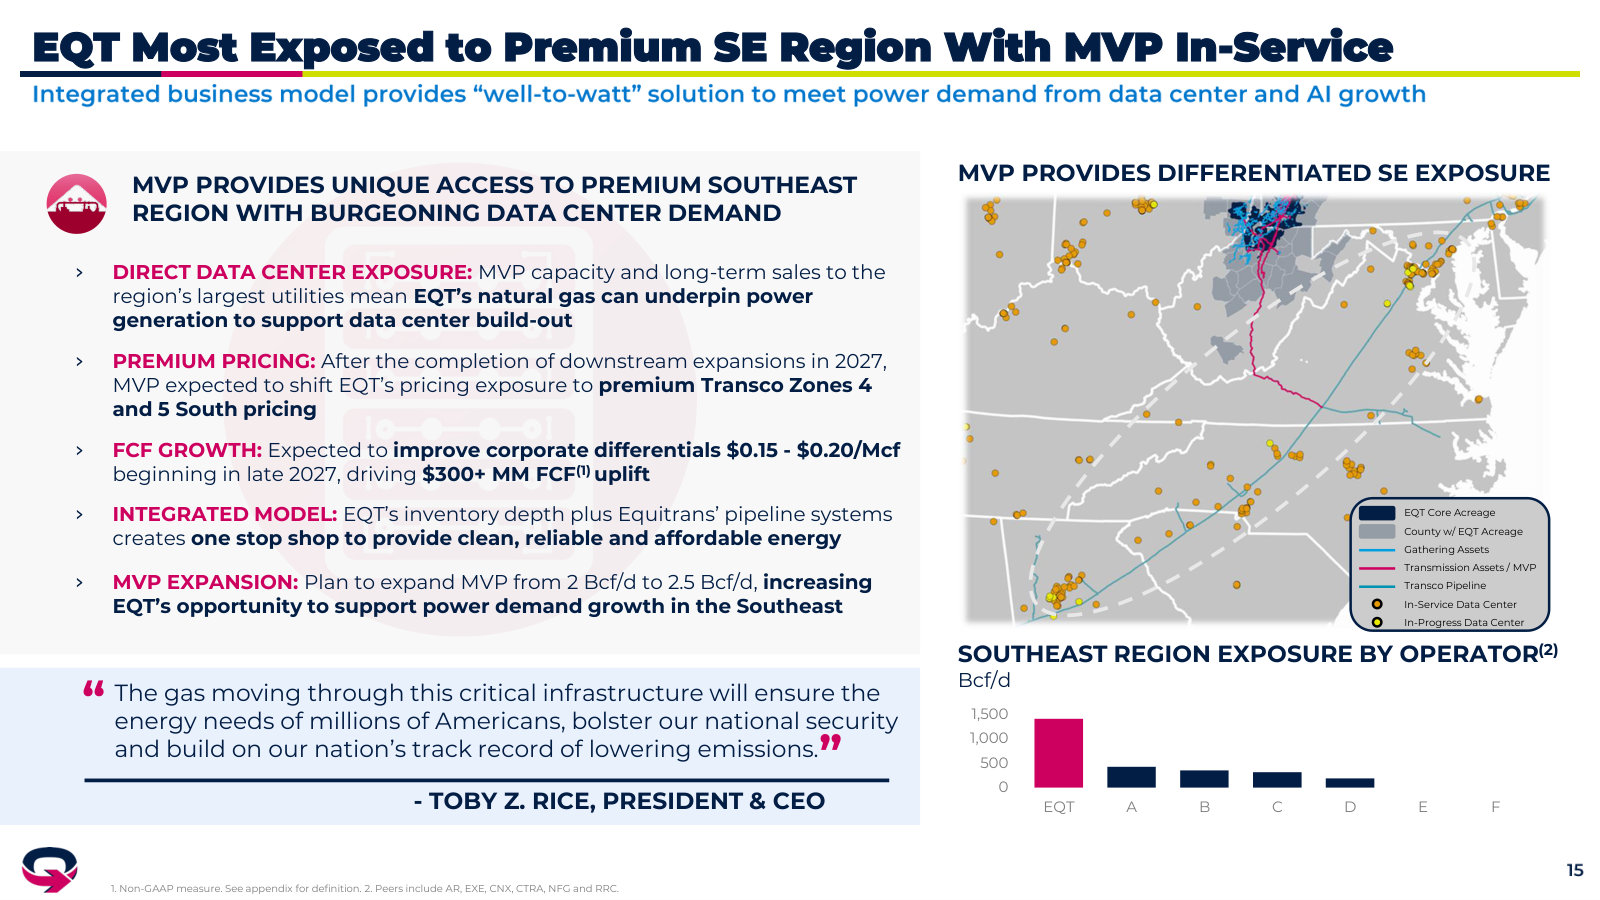
p. 5 — The Equitrans integration three months after close — >60% of tasks done, the concrete proof behind the synergy case. · Open the full presentation →p. 6 — Synergy capture running ahead of underwriting — $145MM annualized, ~20% above plan, within three months of closing. · Open the full presentation →p. 7 — What vertical integration buys, concretely — linking EQT and Equitrans water systems for ~$70MM in savings and record completions. · Open the full presentation →p. 8 — Completion efficiency at all-time highs, opening the door to running two frac crews instead of three — the cost-structure lever. · Open the full presentation →p. 12 — Why the model is durable — deepest Appalachian inventory versus peers, alongside cumulative FCF across gas-price scenarios. · Open the full presentation →p. 15 — The 'well-to-watt' model — MVP gives EQT premium Southeast exposure to feed data-center and power demand. · Open the full presentation →
Investor Presentation — Q4 2025 Results — Q4 2025 · 46 pages · Full-year 2025 results and 2026 guidance, plus the Winter Storm Fern stress test that put the integrated model to work. · Open →
Investor Presentation — Q4 2024 Results — Q4 2024 · 36 pages · The first full year reported as the combined EQT + Equitrans, with the 2025 operating plan. · Open →
Investor Presentation — Q2 2024 Results — Q2 2024 · 37 pages · The deck around the July 2024 Equitrans close — EQT at the pivot from standalone producer to integrated enterprise. · Open →